
FIGURE 5.
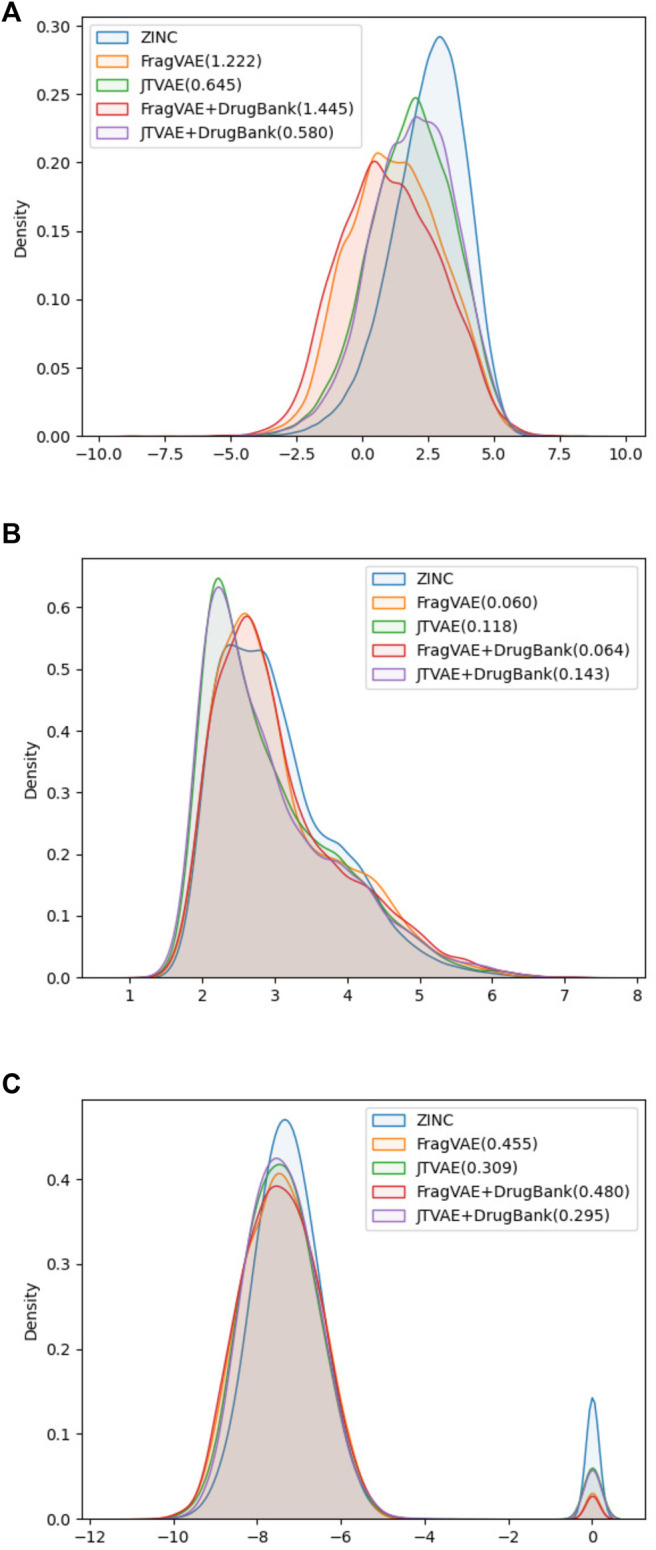
Property distributions on SAS (A), logP (B), and BAS (C) with 1-Wasserstein distances between the final population (10th) of DEL and the original ZINC data.
Official websites use .gov
A
.gov website belongs to an official
government organization in the United States.
Secure .gov websites use HTTPS
A lock (
) or https:// means you've safely
connected to the .gov website. Share sensitive
information only on official, secure websites.
Property distributions on SAS (A), logP (B), and BAS (C) with 1-Wasserstein distances between the final population (10th) of DEL and the original ZINC data.