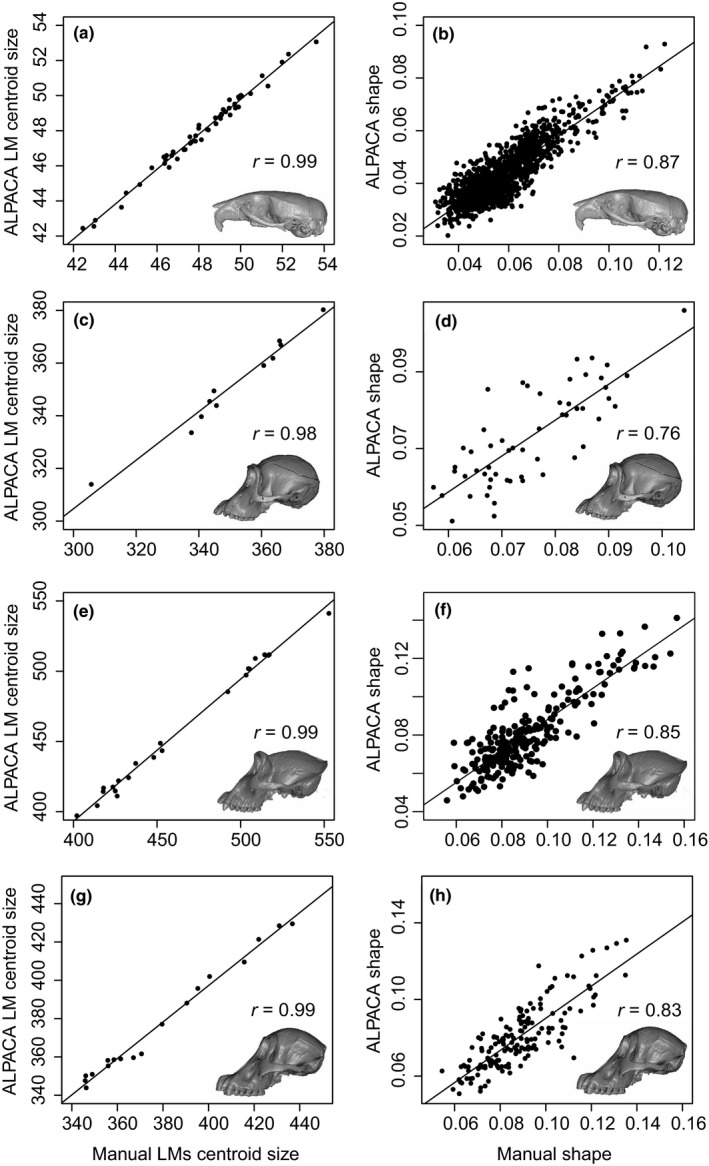
FIGURE 6.

Comparison of centroid size (a–c–e–g) and shape (b–d–f–h) measures as predicted by ALPACA and by manual annotation. Note the high and statistically significant correlations (p < 0.001) across all datasets. Correlation values for each PC are presented in Figure 7. (a, b) Mus; (c, d) Pan; (e, f) Gorilla, (g, h) Pongo
