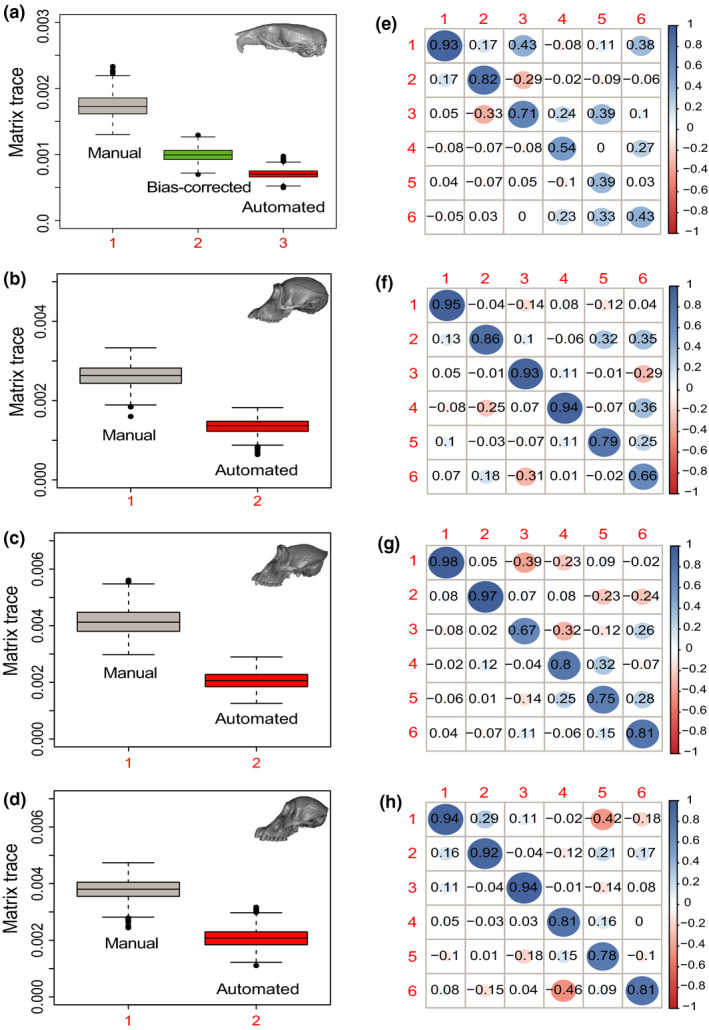
FIGURE 7.

(a–d) Estimates of overall craniofacial variance obtained by bootstrap resampling the trace of each covariance matrix. (e–h) Correlation between the automated and manual PC scores for the first six PCs in the manual PC space. First row = Mus; Second row = Pan; Third row = Gorilla; Fourth row = Pongo
