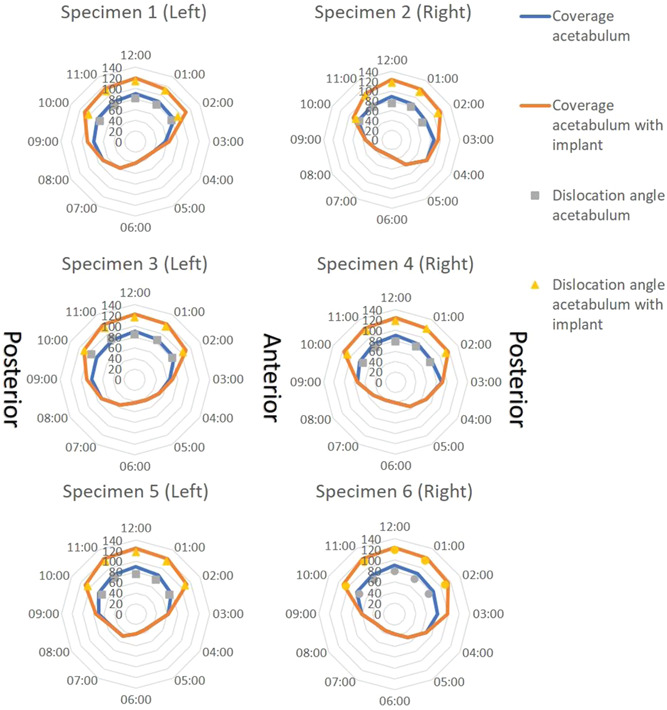
Figure 5.

Clock face graphs of each biomechanical hip specimen. Hips 1&2, 3&4, and 5&6 were from the same dogs. The lines provide the Norberg angles calculated on reformatted CT images, so the modified planes align with the clock face positions. The markers show the dislocation angle at which the femur dislocated from the acetabulum in each load‐bearing clock face position with (yellow) or without (grey) shelf implant [Color figure can be viewed at wileyonlinelibrary.com]
