
FIGURE 2.
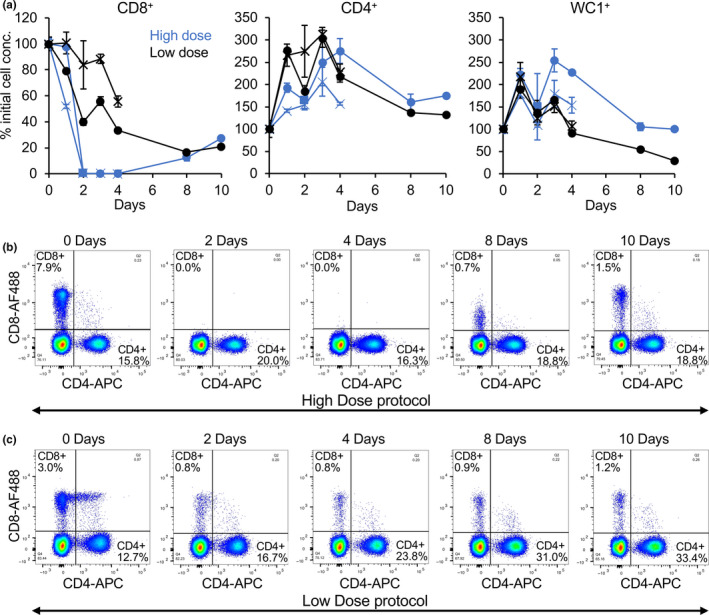
Pilot study of depletion of CD8+ T cells in goats. Goats were treated with two different protocols to deplete CD8+ T cells, as described in Materials and Methods. (a) At the indicated times, the concentration of CD8+, CD4+ and WC1+ T cells in whole blood was determined and shown in blue for the animals given the high‐dose protocol and in black for animals given the low‐dose protocol; to allow for the wide variation in normal cell concentrations between animals, the concentrations were normalized between animals by setting to % of the pre‐treatment concentration (% initial cell conc.). (b, c) Examples of flow cytometry data from animals given the high‐dose (b) or low‐dose (c) protocols, illustrating the relative loss of CD8+ T cells in the two protocols