. 2021 Aug 19;54(1):74–81. doi: 10.1002/lsm.23453
© 2021 The Authors. Lasers in Surgery and Medicine Published by Wiley Periodicals LLC
This is an open access article under the terms of the http://creativecommons.org/licenses/by-nc-nd/4.0/ License, which permits use and distribution in any medium, provided the original work is properly cited, the use is non‐commercial and no modifications or adaptations are made.
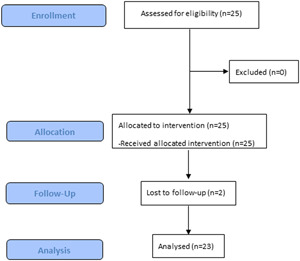
Figure 1.

Study overview. A flow chart representing patient enrollment
