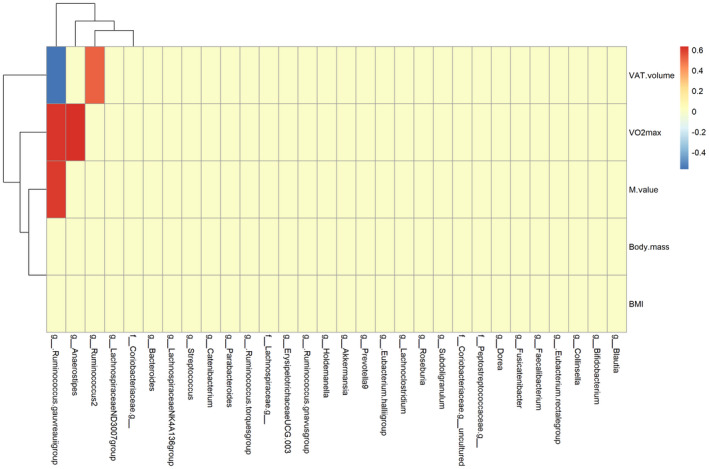
FIGURE 4.

Correlations between participant characteristics (M‐value, body mass, BMI, VAT volume, and VO2 max) and the 30 most abundant genera of gut microbiota in fecal samples (data from before and after the exercise intervention). VAT, visceral adipose tissue [Colour figure can be viewed at wileyonlinelibrary.com]
