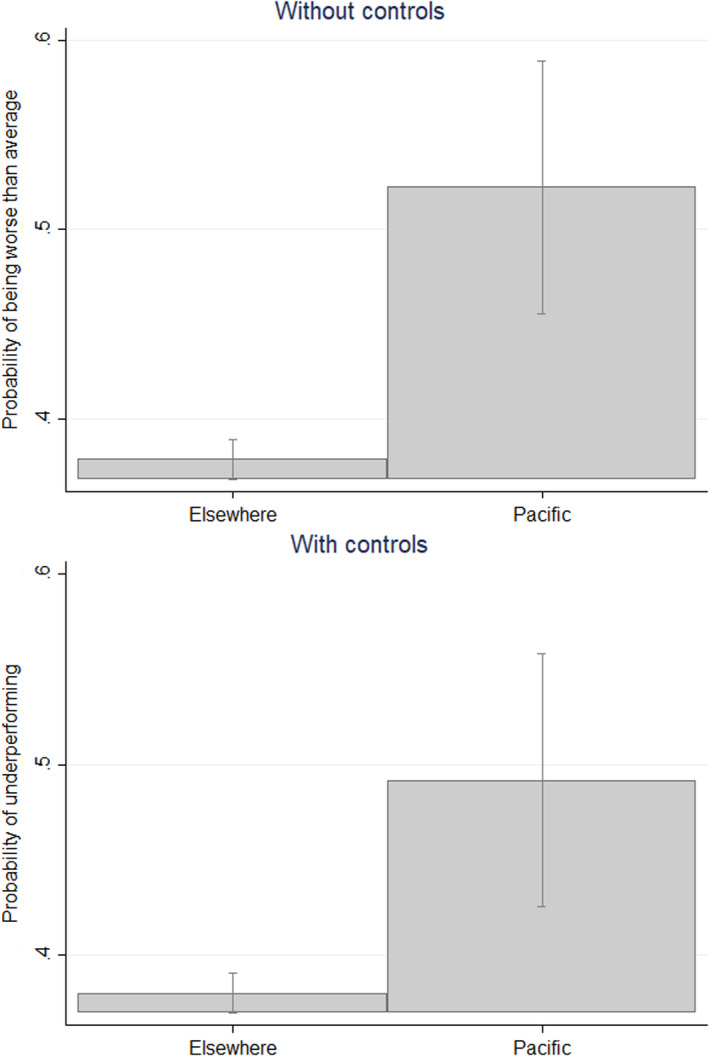
FIGURE 1.

Probability of underperforming, Pacific projects and elsewhere
Notes: data come from 1996 and thereafter. Data are from all donors with projects in the Pacific. Values are predicted probabilities of projects performing worse than the donor’s mean project in that year. Predicted probabilities come from logistic regressions. In the second panel, regressions are run with project traits controlled for.
