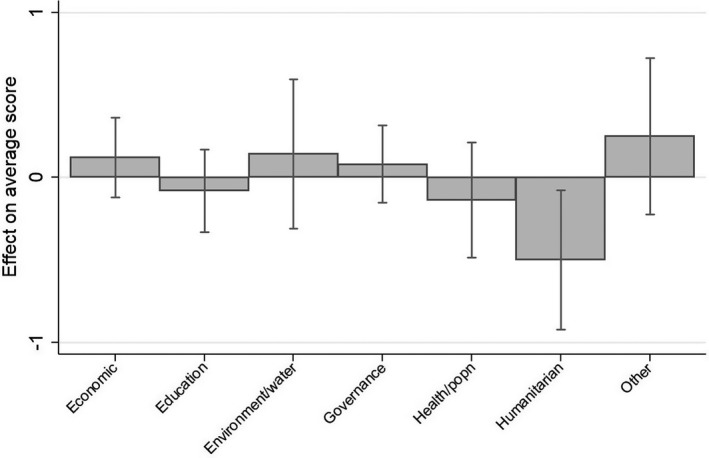
FIGURE 2.

Differing sectoral performance in the Pacific compared with elsewhere
Notes: The figure shows the predicted marginal effect of the difference in average performance between the Pacific and elsewhere for each sector. Estimates stem from the regression results shown in Table 6.
