
FIGURE 1.
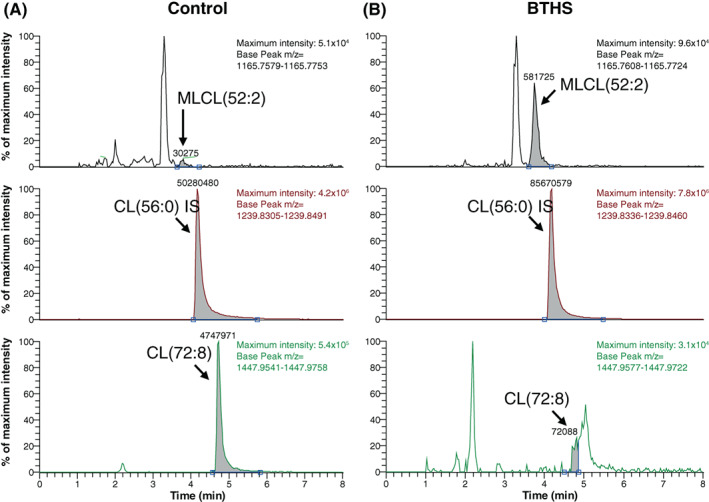
Extracted ion chromatograms of control and BTHS. Extracted ion chromatograms of MLCL(52:2), CL(56:0) = internal standard and CL(72:8) of control (left panels) and BTHS (right panel). Maximum intensity and selected m/z value (base peak) is shown in the right corner of each extracted ion chromatogram. In BTHS, MLCL(52:2) is elevated and CL(72:8) is deficient when compared to control (note the low indicated maximum intensity of the extracted ion chromatogram of the BTHS individual, about 10‐fold lower than that of the control)