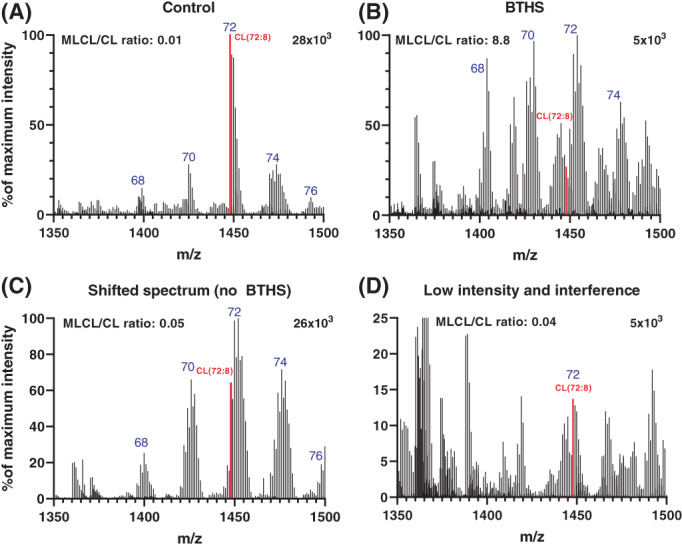
FIGURE 3.

CL spectra used to evaluate a possible BTHS diagnosis. Example CL spectra of a control (A), an individual with BTHS (B), a shifted spectrum (C), and a low intensity/interference spectrum (D). Graphs show the CL range of the spectrum (m/z 1350‐1500) containing the different CL major clusters (blue, the summed amount of carbon atoms in the fatty acid side chains), the CL(72:8) peak (highlighted in red), the corresponding MLCL/CL ratio and the maximum intensity (response on the MS‐detector) corresponding to the maximum of the y‐axis shown
