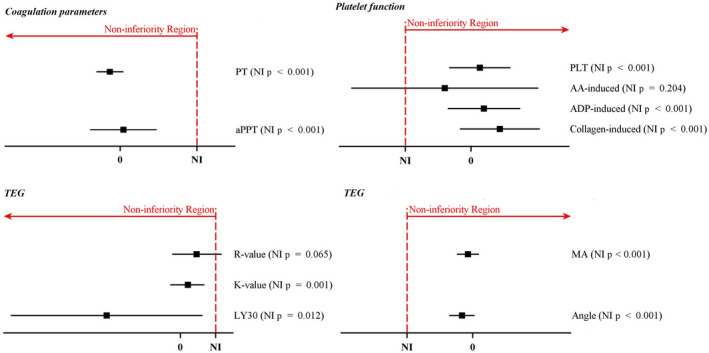
Figure 4.

Forest plot of non‐inferiority tests on coagulation and platelet function. The estimated difference of HES compared with albumin is shown as a square and error bars indicate the 95%CI. Non‐inferiority delta is 15% of the control group mean. Non‐inferiority of each outcome was claimed if p < 0.025. NI, non‐inferiority; PT, prothrombin time; aPTT, activated partial thromboplastin time; PLT, platelet count; AA, arachidonic acid; ADP, adenosine diphosphate; TEG, thromboelastogram; R value, reaction time; K value, kinetics; LY 30, amplitude at 30 min; MA, maximum amplitude.
