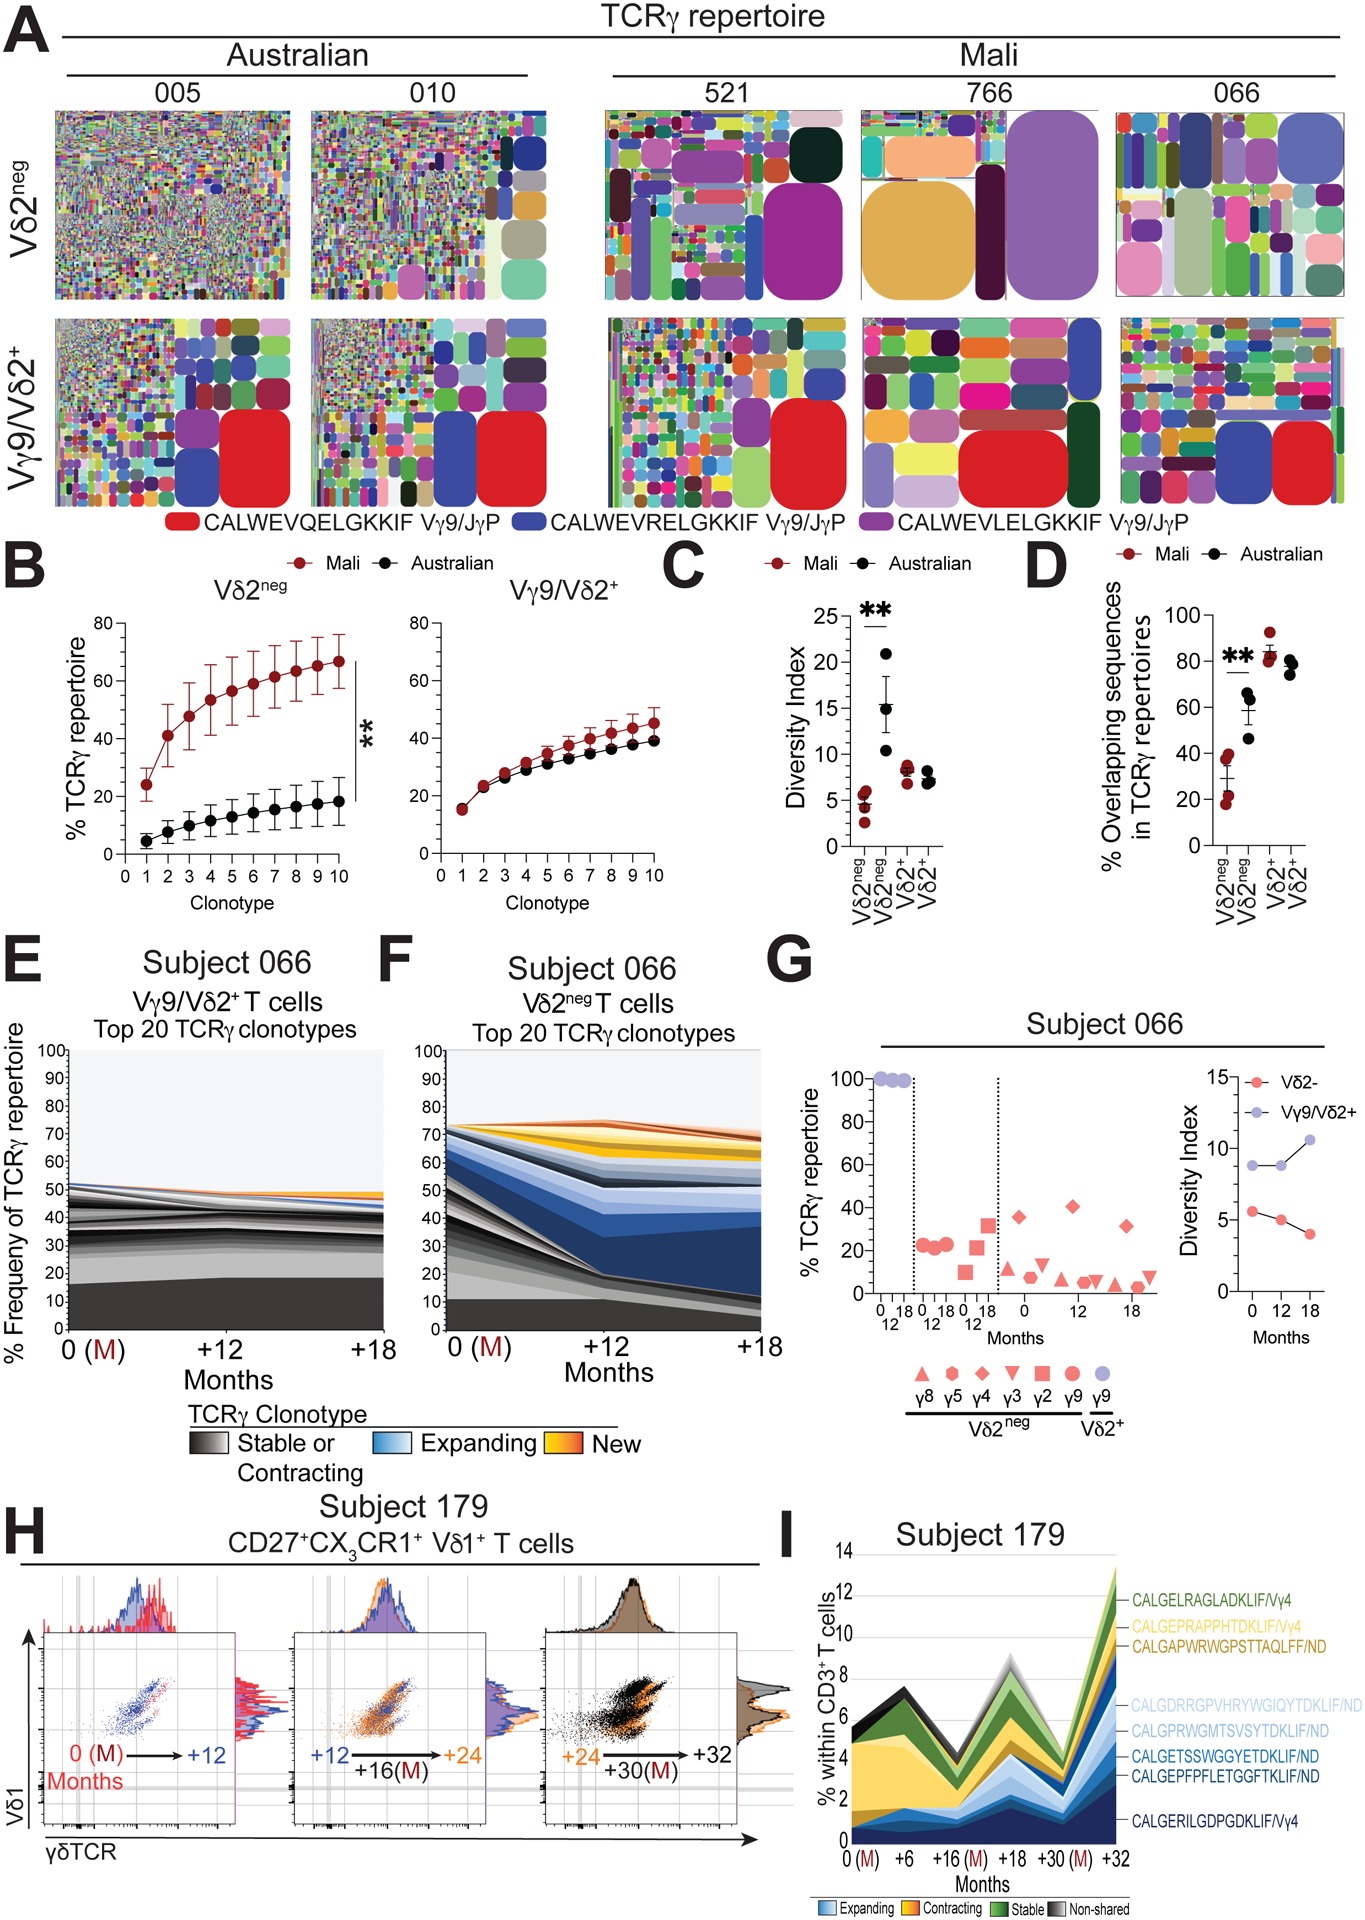
Figure 2. γδTCR repertoires in Malian subjects evolve over time.

A. TCRγ clonotype tree plot analysis of Vδ2neg and Vγ9/Vδ2+ T cell populations from Australian children or Malian children during stable periods without malaria transmission. Tree plots show unique clonotypes (coloured segments) and their proportion within the total repertoire (size), in general coloured clonotypes do not match between plots unless indicated. B. Pooled accumulated frequency curves of the top 10 most prevalent clonotypes in Vδ2neg or Vγ9/Vδ2+ TCR repertoires (Australian, n=3; Mali, n=4). C. Diversity index of Vδ2neg and Vδ2+ γδ T cell repertoires in Malian (n=4) or Australian (n=3) subjects. D. Frequency of shared CDR3γ (a.a.) sequences in Vδ2neg and Vγ9/Vδ2+ T cell repertoires (Australian, n=3; Mali, n=4). E. Longitudinal tracking of the 20 most abundant TCRγ clonotypes in Vγ9/Vδ2+ and F. Vδ2neg T cell repertoires over time in subject 066. (M) indicates acute febrile malaria. G. Longitudinal analysis of Vγ chain usage and diversity index for Vδ2neg (red) and Vγ9/Vδ2+ (blue) T cell repertoires from subject 066. H. γδTCR expression patterns within (CD27lo CX3CR1+) Vδ1+effector populations in donor 179. Each flow cytometry plot has two time points overlaid, indicated by an arrow, together covering three febrile P. falciparum infections (months 0, 17 and 30). I. TCRδ clonotypes sequencing relative to total CD3+ T cells from subject 179. Error bars indicate means ± SEM. Normality was tested using the Shapiro-Wilk test.; *P < 0.05; **P < 0.01; ***P < 0.001; p-values were determined by two-way ANOVA with Sidaks post hoc testing (b) and one-way ANOVA with Holm-Sidaks post hoc testing (c, d).
