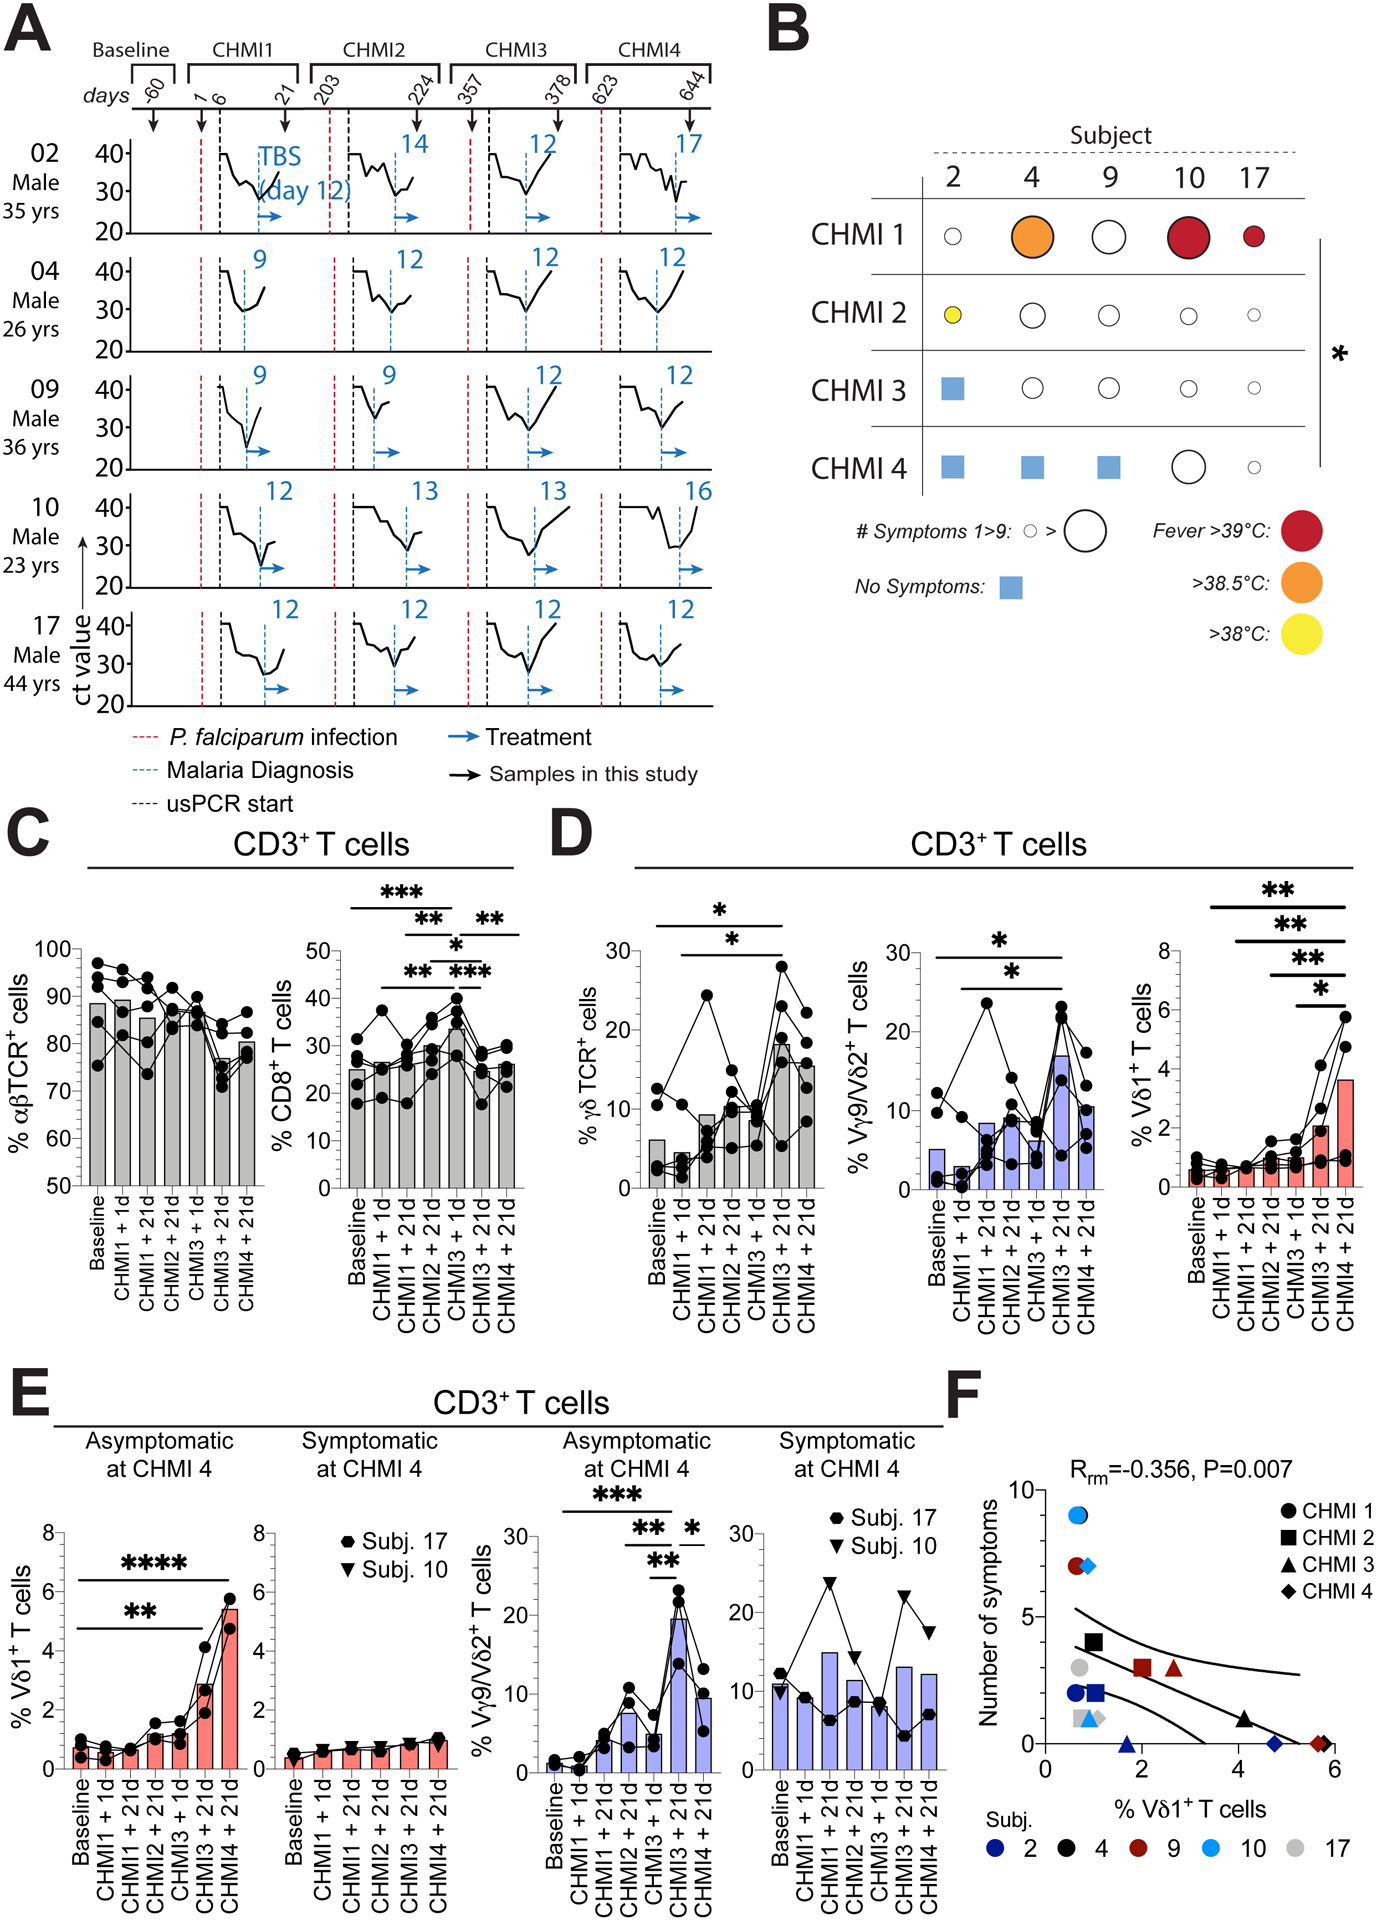
Figure 3. Repeated controlled P. falciparum infection drive clinical immunity to malaria and increased frequencies of γδ T cells.

A. Controlled human malaria infection (CHMI) study subjects, samples, parasite ultra-sensitive PCR (usPCR) detection curves and diagnosis by blood smear. B. Symptomology and fever analysis of each subject during each CHMI. C-E. Within total CD3+ T cells: C. Total αβ+ and CD8+ T cell frequencies. D. Total γδ+, Vγ9/Vδ2+ (blue), and Vδ1+ (red) γδ T cells frequencies and E. Vδ1+ and Vγ9/Vδ2+ frequencies in individuals that were asymptomatic or symptomatic at CHMI4. F. Repeated measure correlation between Vδ1+ frequencies within total CD3+ T cells and the number of symptoms each individual suffered at each CHMI. Bars show the mean. *P < 0.05; **P < 0.01; ***P < 0.001; ****P < 0.0001; p-values were determined by Kruskall-Wallis test (b), linear mixed effects modelling with Bonferroni’s correction (c, d, e) and repeated measures correlation (f).
