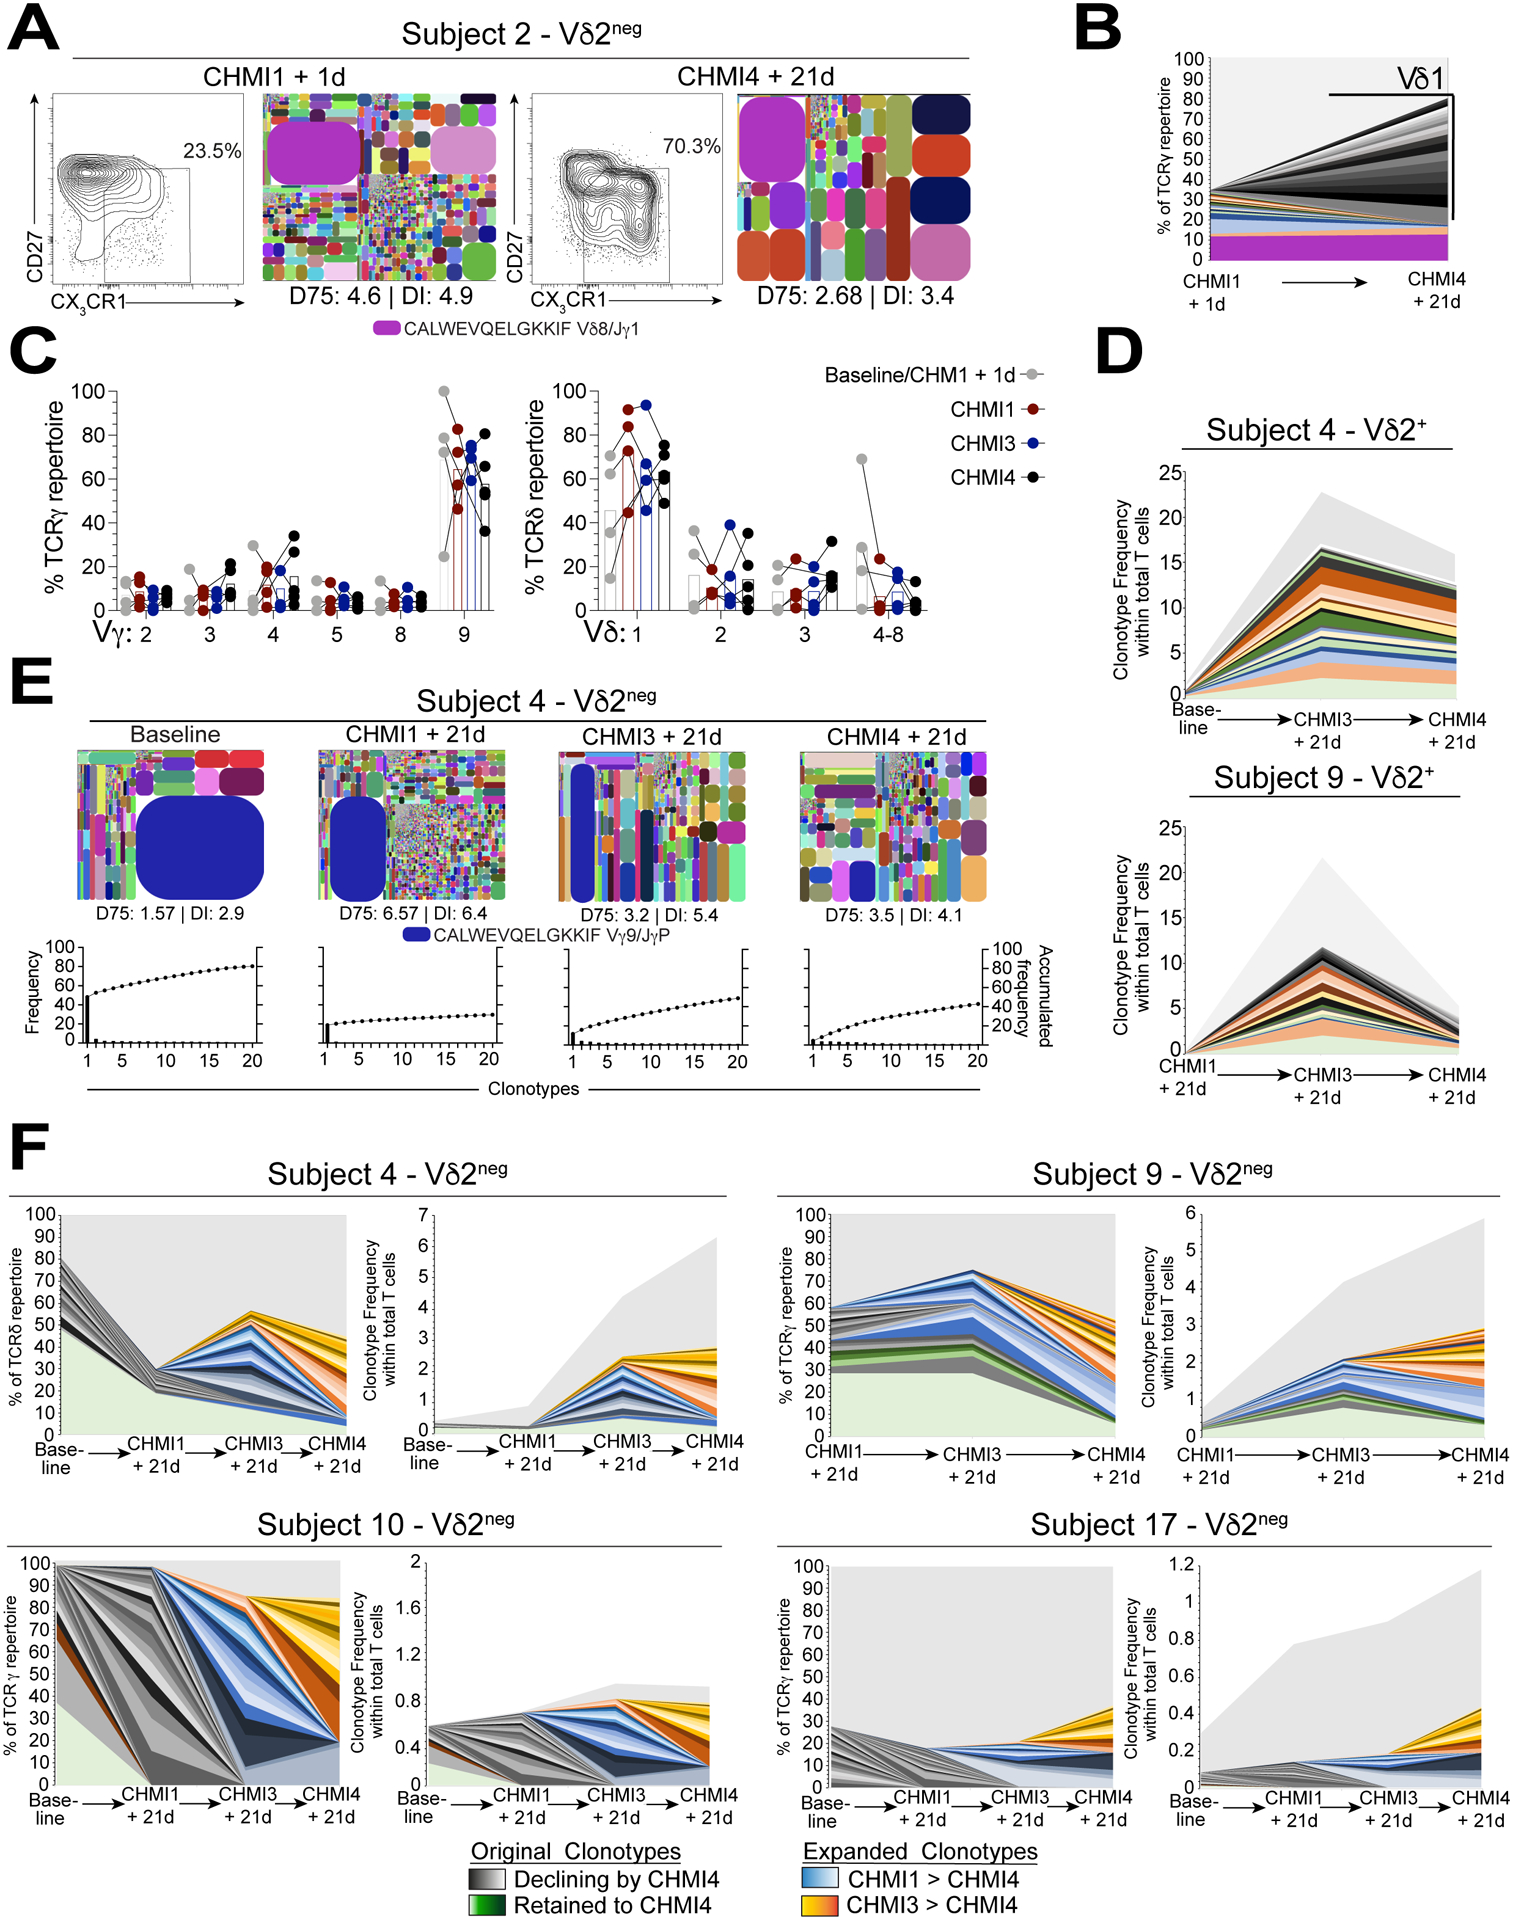
Figure 5. Repeated P. falciparum infection drives waves of Vδ1 TCR clonotype selection.

A. Flow cytometry plots showing frequencies of CD27lo CX3CR1+ Vδ2neg γδ T cells after repeated CHMI challenge in subject 2. TCRδ tree plots of the corresponding total Vδ2neg γδ T cells and DI are given for each tree plot. B. Increase in new Vδ1 sequences between baseline and CHMI4 within the top 20 clonotypes in TCRγ from subject 2. C. Vγ and Vδ usage in Vδ2neg T cell repertoires from baseline to CHMI 4 (n=4–5). D. Longitudinal tracking of the top 20 CDR3γ clonotypes in Vδ2+ T cell repertoires as a frequency of total CD3+ T cell populations. E. TCRγ tree plots showing Vδ2neg TCR repertoires at baseline and after repeated CHMIs in subject 4. The D75 and DI metrics are indicated. The graphs show the accumulated frequency of the top 20 clonotypes for each repertoire. F. Longitudinal tracking of the top 20 CDR3γ clonotypes in Vδ2neg TCR repertoires from subject 4, 9, 10, 17; displayed as a proportion of the total TCRγ repertoire (left) or within the total CD3+ T cell population (right).
