
Figure 6. Previous P. falciparum exposure licenses Vδ1+ T cells for parasite reactivity.
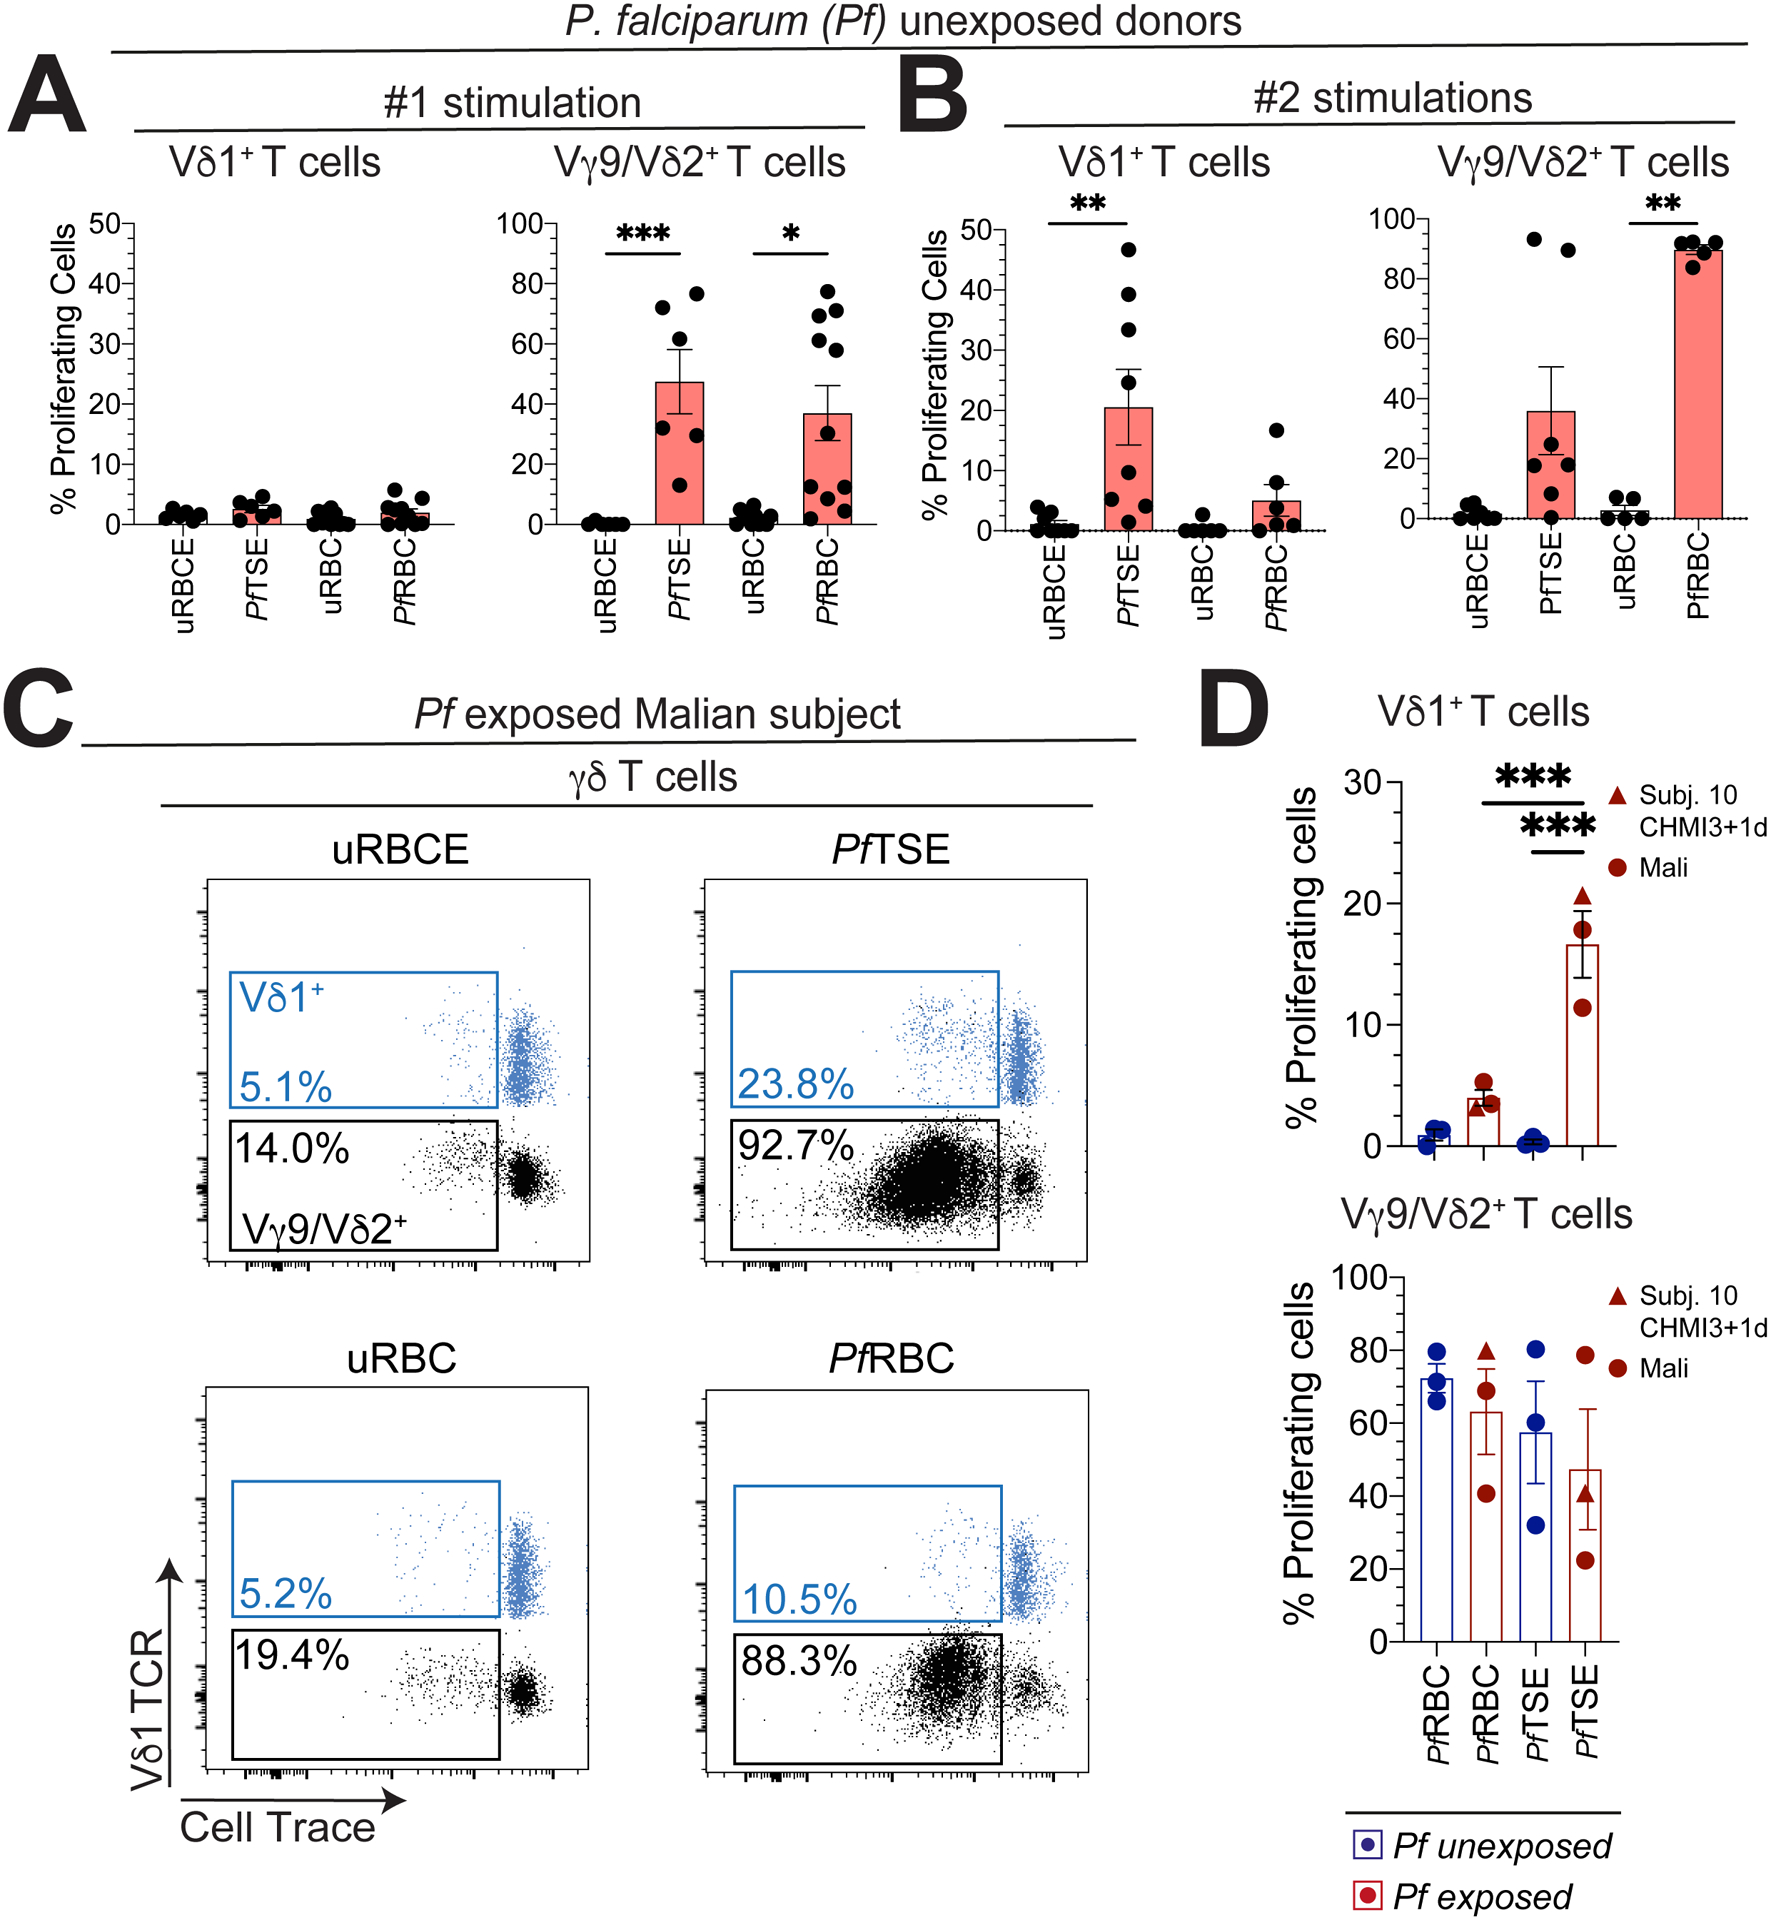
Vδ1+ and Vγ9/Vδ2+ T cells were assessed for proliferation in Australian adult donors with no history of malaria, PBMCs were labelled with cell trace and incubated for 6 days with A. One or B. two stimulations (at day 0 and 3 of culture) with P. falciparum trophozoite/early schizont extract (PfTSE) or infected red blood cells (RBCs) and uninfected RBCs (uRBC) or extract (uRBCE) (uRBCE/PfTSE: n=6; uRBC/PfRBC: n=10). C. Representative flow cytometry plots show Vδ1+ (blue) and Vδ2+ (black) T cells assessed for proliferation in the PBMCs from a Malian subject after co-culture with PfTSE. PfRBCs, uRBC or uRBCE controls. D. Graphs show the proliferation of Vδ1+ and Vγ9/Vδ2+ T cells from two Malian subjects with a history of repeated prior exposure to P. falciparum malaria, subject 10 at CHMI3 + 1d and three independent Australian donors with no history of malaria exposure. Each data point represents the proportion of proliferating cells in cultures exposed to PfRBCs or PfTSE minus the response to uRBC or uRBCE controls. Bars show the mean ± SEM. Normality was tested using the Shapiro-Wilk test.; **P < 0.01; p-values were determined by one-way ANOVA with Holm-Sidak’s post hoc testing (d).