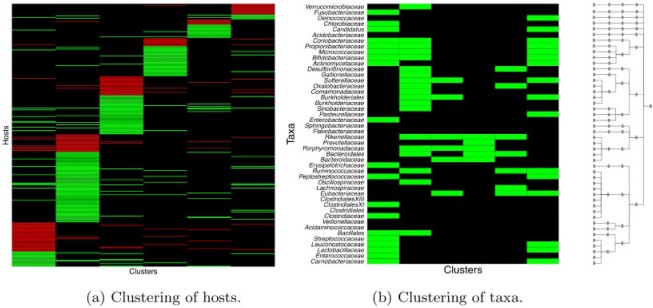
Fig. 2.
Real data. Heatmaps of estimated clusters using the proposed MMF. Colored cells are ones and black cells are zeros. Rows of  are hosts arranged in a block-diagonal-liked form. Rows of
  are taxa which are arranged according to the taxonomic rank tree. Each column represents a cluster with overlaps. The red/green cells in the heatmap of
  represents patients/controls with ones.

