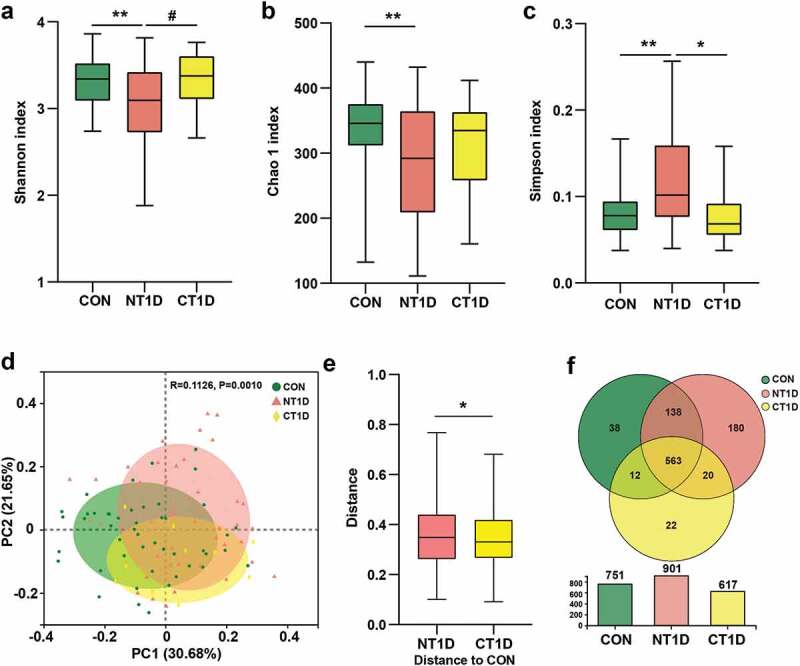
Figure 2.

Taxonomic profiles of oral microbial communities in T1D. (a-c) Microbial community richness (Chao 1) and diversity (Shannon and Simpson). (d) PCoA analysis of three groups based on the Bray-Curtis distance. (e) Distance compared to the CON group through the Anosim algorithm. (f) Venn diagram showing the overlap of OTUs between groups. Data were expressed as mean ± S.E.M. # 0.05 < P < 0.1, *P < 0.05, **P < 0.01.
