
Figure 1.
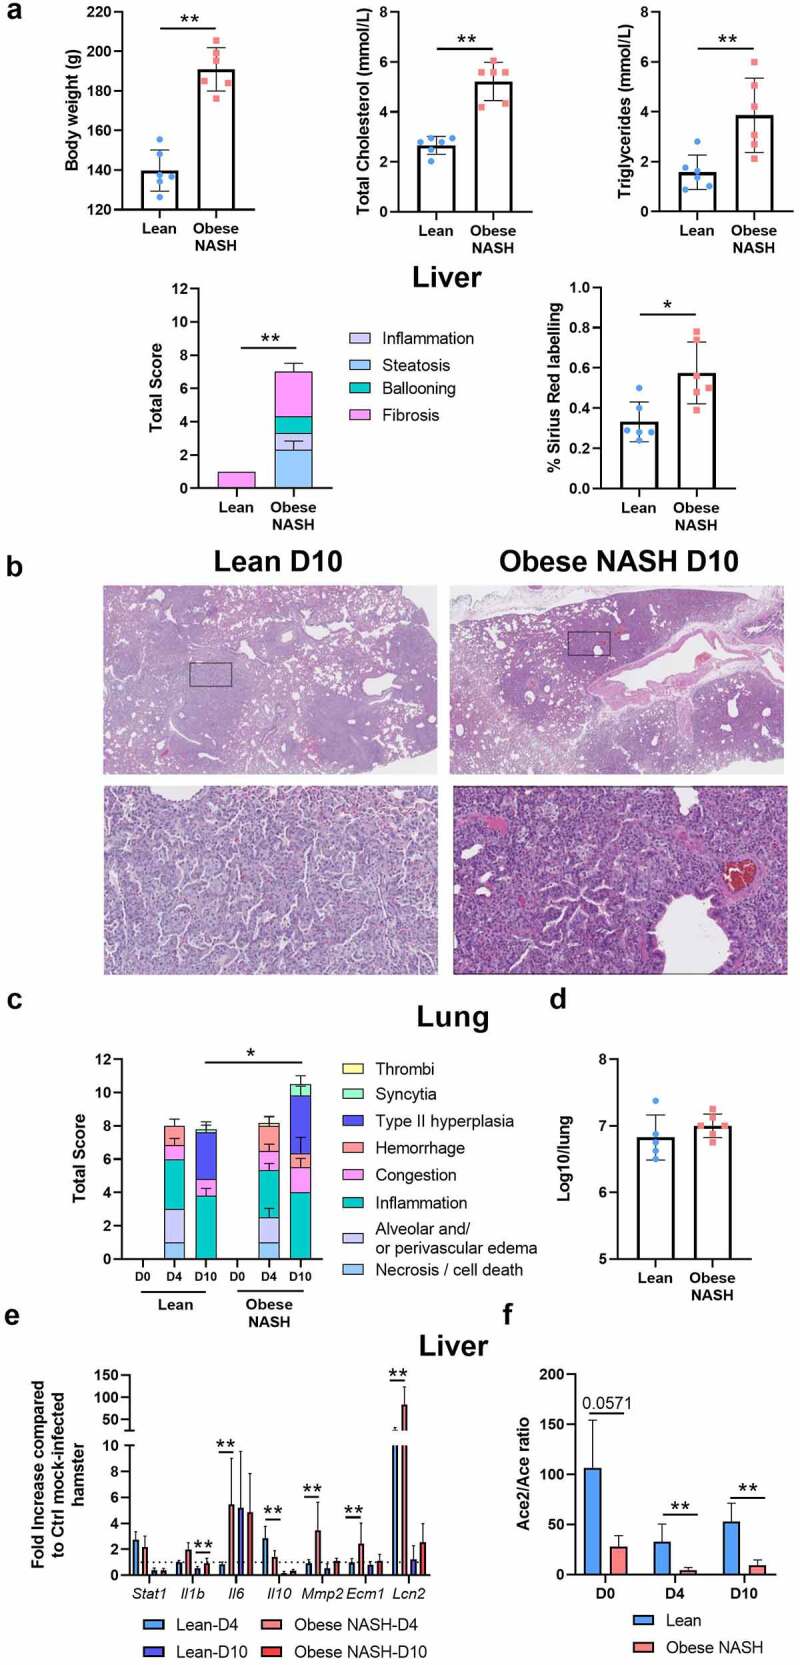
Establishment of a sublethal model of SARS-CoV-2 infection in obese NASH hamsters. (a), Clinical and biochemical parameters in lean and obese NASH hamsters. Body weight, total cholesterol and triglyceride concentrations in serum and liver pathology are shown. Total nonalcoholic fatty liver disease activity score and sirius red labeling score are depicted. (b), Lean and obese NASH hamsters were inoculated with 2 × 10⁴ tissue culture infectious dose 50 (TCID50) of the clinical SARS-CoV-2 isolate hCoV-19/France/lDF0372/2020. Histopathological examination of lung sections of SARS-CoV-2-infected hamsters lean and obese NASH hamsters (10 dpi). Representative images of lungs (hematoxylin and eosin staining) are depicted (x20). (c), Blinded sections were scored for levels of pathological severity. To evaluate comprehensive histological changes, lung tissue sections were scored based on criteria indicated in the panel. The following scoring system was used: 0, no pathological change; 1, affected area (≤10%); 2, affected area (<50%, >10%); 3, affected area (≥50%). The average sum of different parameters is shown. (d), Infectious viral loads in the lungs at D4. Data are expressed as the number of infectious virus particles per lung. At D10, no virus was detected in the lungs (not shown). (e and f), The liver of mock-infected and SARS-CoV-2-infected lean and obese NASH hamsters were collected at D4 and D10. mRNA copy numbers of genes were quantified by RT-PCR. Data are expressed as fold increase ± SD over average gene expression in mock-treated lean animals. (a-f), A representative experiment out of two is shown (n = 3–6/time point). Significant differences were determined using the Kruskal-Wallis ANOVA with Dunn’s posttest (*P < .05; ** P < .01; *** P < .001) .