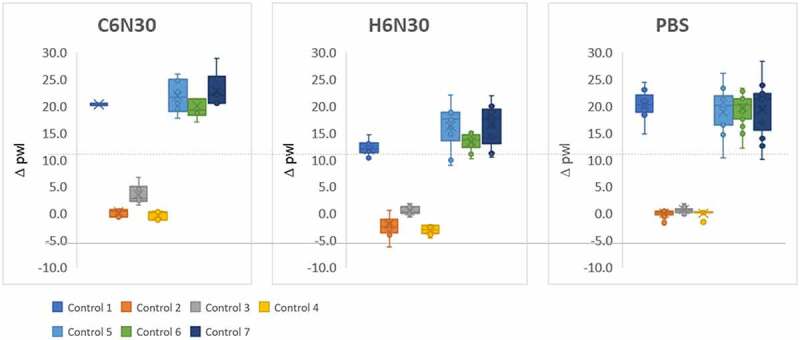
Figure 2.

PS-SINS results of 7 control mAbs measured in C6N30, H6N30, and PBS over 10 times are displayed in box and whisker plot.Three, side-by-side box and whisker plots. The left plot, labeled C6N30, the middle labeled H6N30 and the right labeled PBS. The y-axis is labeled delta pwl. A dashed line is drawn across all 3 plots right above the number 10.0. Controls 2–4 are below the dashed line, close to 0, in all 3 plots. Controls 1, 5, 6 and 7 are above the dashed line in all 3 plots. The legend is located below the plot to the left, with the different controls having a different color assignment.
