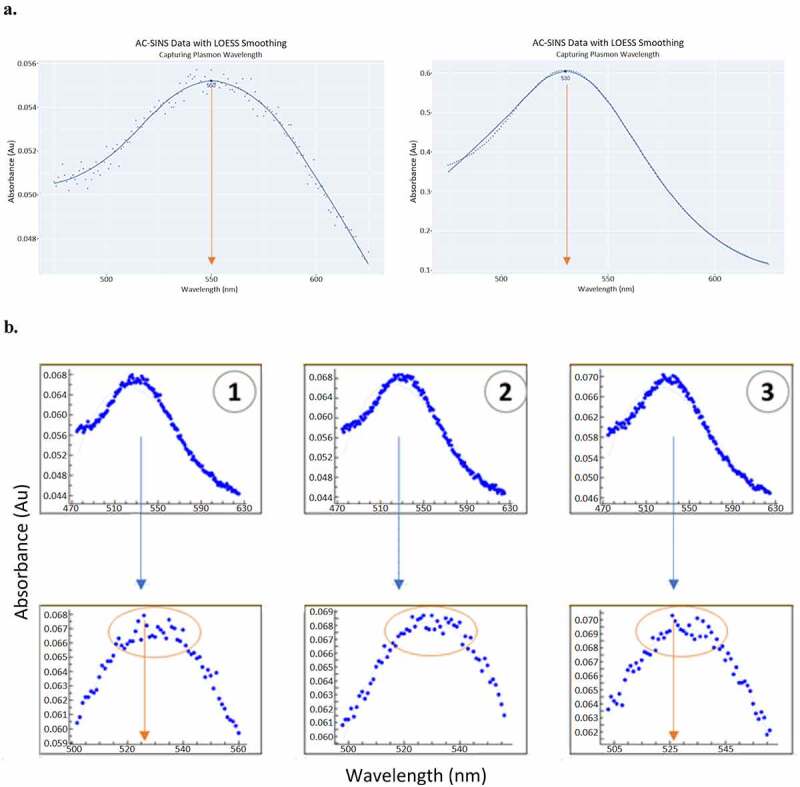
Figure 4.

Apply LOESS method for improved accuracy capturing the peak of plasmon wavelength (a). Peak of plasmon wavelength can be extrapolated robustly, regardless of suboptimal (left) or optimal (right) raw data, by drawing a smooth curve through the data points and unbiased by outlying values near the peak. LOESS method avoids the pitfall of the commonly practiced method (EXCEL macro and EXCEL fit), which can mis-calculate the peak of plasmon wavelength due to local fluctuation of readings (b). The top panel of (B) shows the raw data (entire scan) and the bottom panel is the zoom in of the peak area, the outlier points can challenge curve fitting of the traditional method.(a) Two panels of plasmon wavelength plots. Both plots show absorbance on the y axis and wavelength on the x axis. Each panel has plasmon wavelength data and a smooth line drawn through the data. The left panel has suboptimal data that is scattered about the line. The right panel has data that is mostly on the line. (b) Six plasmon wavelength plots in two rows of three. The plots in the bottom row zoom into the peak of the plots in the top row. The plots in the bottom row show how the outliers could lead to the incorrect maximum being determined.
