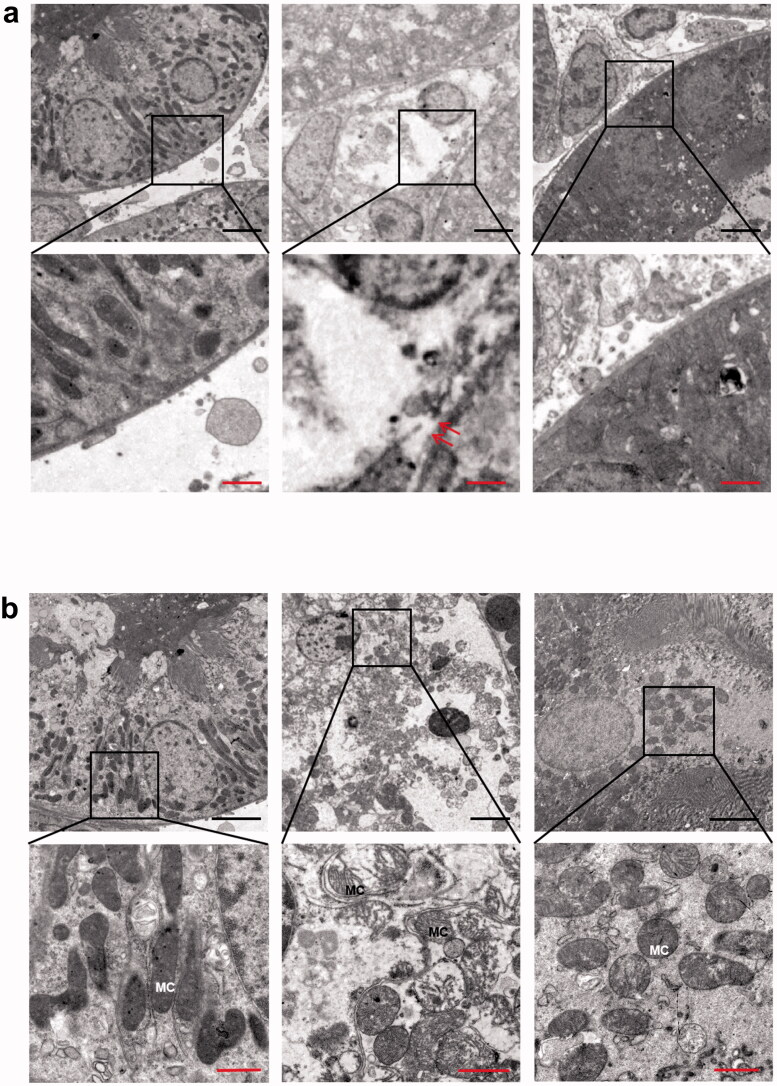
Figure 2.
Representative transmission electron micrographs showing the proximal tubular cell ultrastructure of kidney sections. (a) Cytoplasmic membrane pores were observed in the proximal renal tubule after IR, and fewer were observed in the IR + DSF group. (b) Swollen mitochondria with dilated cristae were observed in the IR group, but fewer were observed in the IR + DSF group. Scale bar: black 4 μm, red 1 μm. Red double arrows: membrane pore; MC: intracellular mitochondria.

