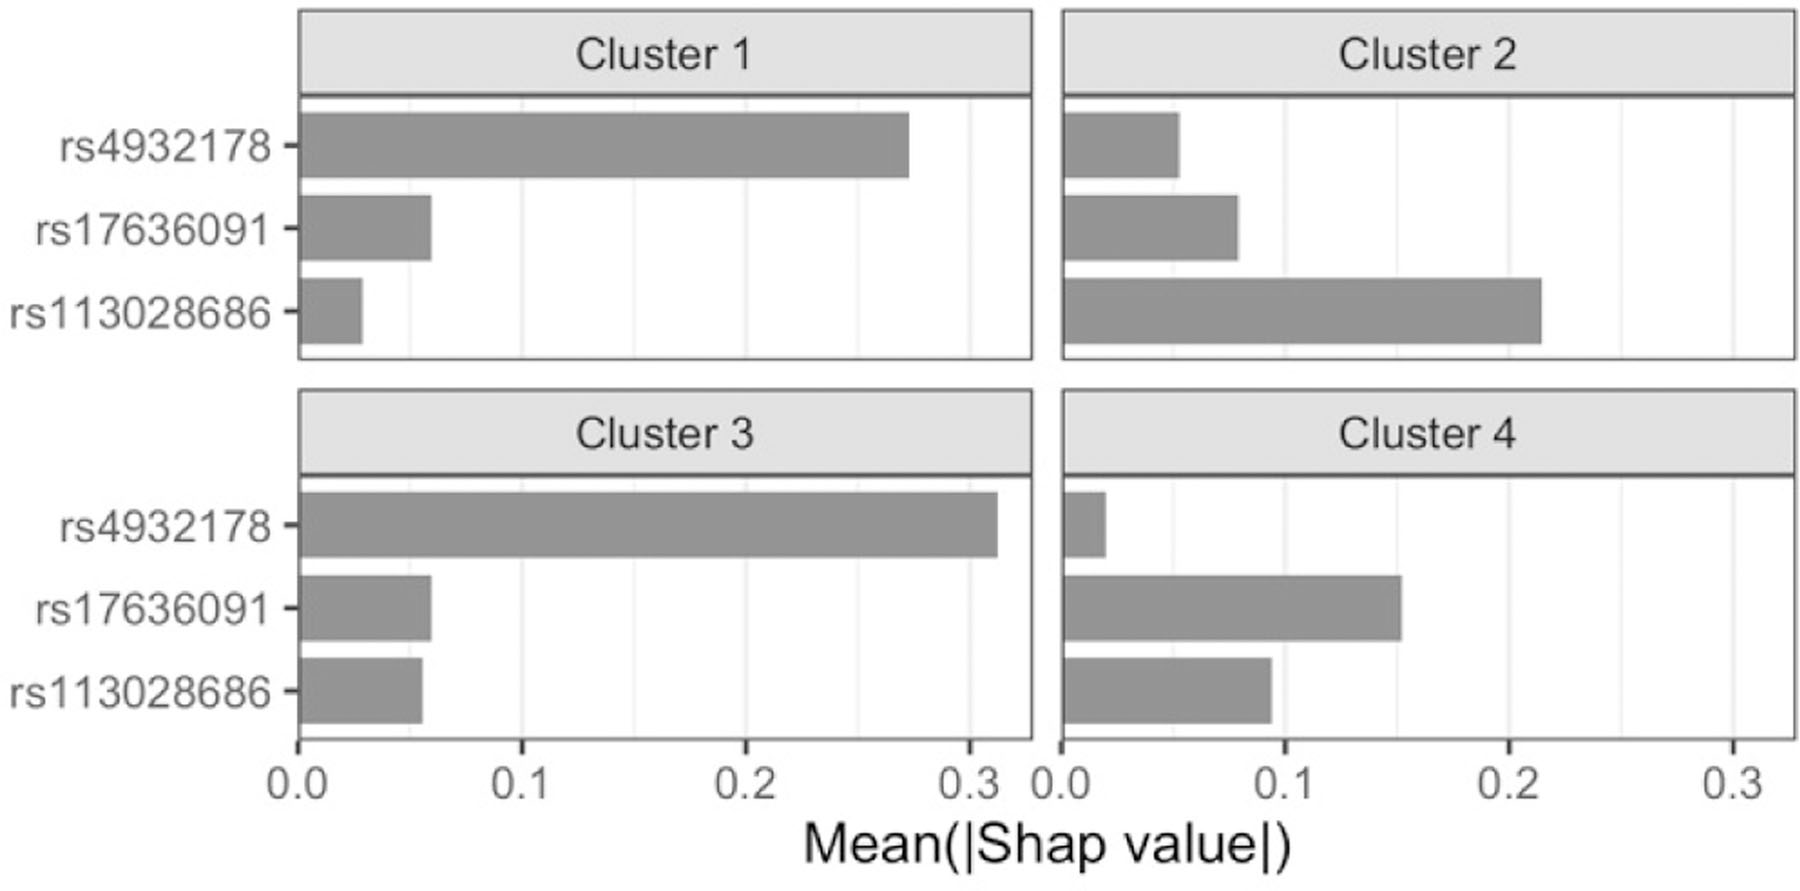
Fig. 5.

Feature rankings within the four SHAP value-based clusters for the correctly classified CAD testing cases in the best stage 2 pipeline from classic TPOT. The x-axis indicates the mean absolute SHAP value for the subjects in that cluster. Only the top 3 (out of 28) features are indicated as all remaining ones have negligible contributions.
