FIGURE 1.

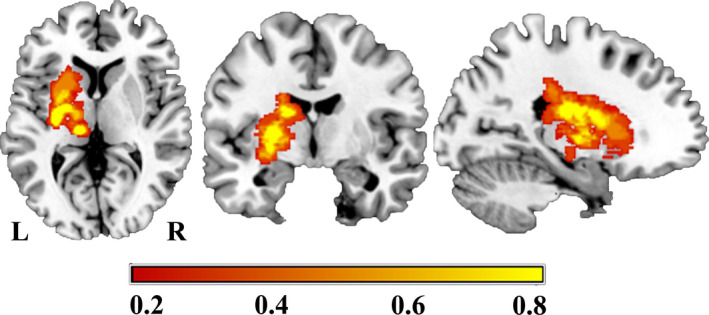
Lesion incidence map for the stroke patients (n = 60). The color bar represents the lesion incidence frequency in each voxel

Lesion incidence map for the stroke patients (n = 60). The color bar represents the lesion incidence frequency in each voxel