
FIGURE 2.
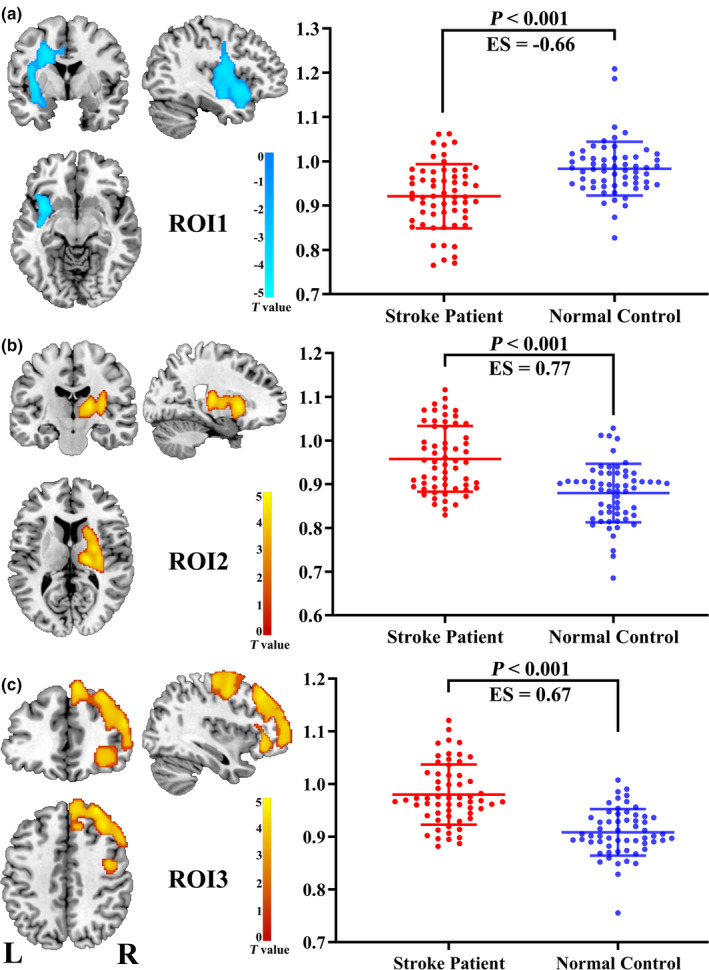
Brain regions showing significant differences between stroke patients (n = 60) and normal controls (n = 60) in the CBF comparison. Abbreviations: CBF, cerebral blood flow; ES, effect size; L: left; R: right; ROI: region of interest
Official websites use .gov
A
.gov website belongs to an official
government organization in the United States.
Secure .gov websites use HTTPS
A lock (
) or https:// means you've safely
connected to the .gov website. Share sensitive
information only on official, secure websites.
Brain regions showing significant differences between stroke patients (n = 60) and normal controls (n = 60) in the CBF comparison. Abbreviations: CBF, cerebral blood flow; ES, effect size; L: left; R: right; ROI: region of interest