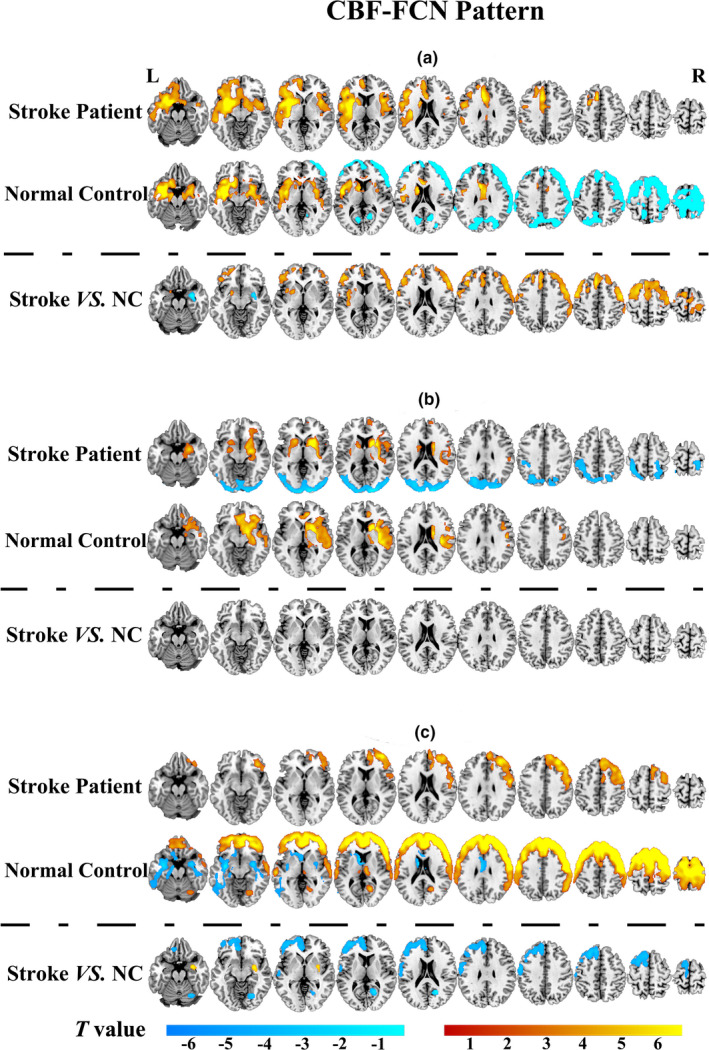
FIGURE 3.

CBF‐FCN pattern and group differences between stroke patients (n = 60) and normal controls (n = 60) within the FCN. (a) the ROI1‐associated FCN; (b) the ROI2‐associated FCN; (c) the ROI3‐associated FCN. The colour in yellow to red indicated positive connections, and slight green to blue indicated negative connections (p < .05 with cFWE correction). Abbreviations: CBF, cerebral blood flow; FCN, functional covariance network; L: left; NC, normal control; R: right
