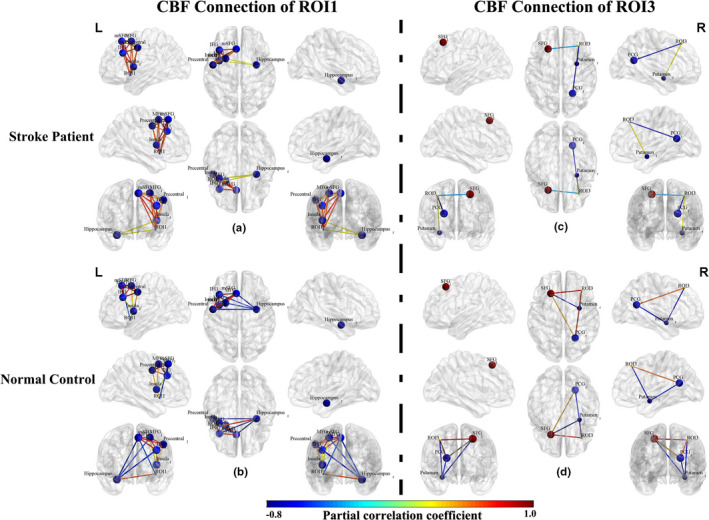
FIGURE 6.

CBF connections in stroke patients (n = 60) and normal controls (n = 60) within the ROI1‐ and ROI3‐associated FCN. The nodes indicate the CBF and CBF covariance measures of specific regions of interest (ROI). The edges in blue to red indicate the significant CBF connections (p < .05) measured by partial correlation coefficients between the regional CBF of ROIs, where the color indicates the value of a partial correlation. Abbreviations: CBF, cerebral blood flow; FCN, functional covariance network; IFG, inferior frontal gyrus; MFG, middle frontal gyrus; mSFG, medial part of SFG; PCG, posterior cingulate gyrus; SFG, superior frontal gyrus
