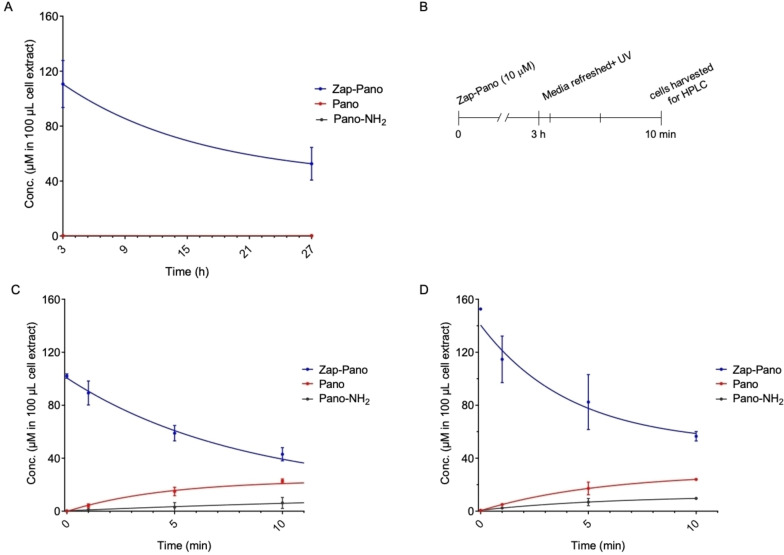
Figure 3.
Photo‐uncaging of Zap‐Pano in cancer cell lines. (A) OE21 cells were treated with Zap‐Pano (10 μM) and incubated for 3 or 27 h Cell lysis was performed in MeCN:MeOH (1 : 1) with a fixed volume of 100 μL. Cell lysate was analysed using HPLC to determine the concentration of Zap‐Pano, Pano and Pano‐NH2. Quantification was made using a calibration curve for Zap‐Pano, Pano and Pano‐NH2 (n=3). (B) A schematic representation of the photo‐uncaging experiments is shown. (C) OE21 cells and (D) HCT116 cells were treated with Zap‐Pano (10 μM). After 3 h, the media containing Zap‐Pano was removed and replaced with fresh media. The cells were then exposed to UV‐light for the time periods indicated (0–10 minutes). Cell lysis was performed in MeCN:MeOH (1 : 1) with a fixed volume of 100 μL. Cell lysates were analysed using HPLC to determine the concentration of Zap‐Pano, Pano and Pano‐NH2.

