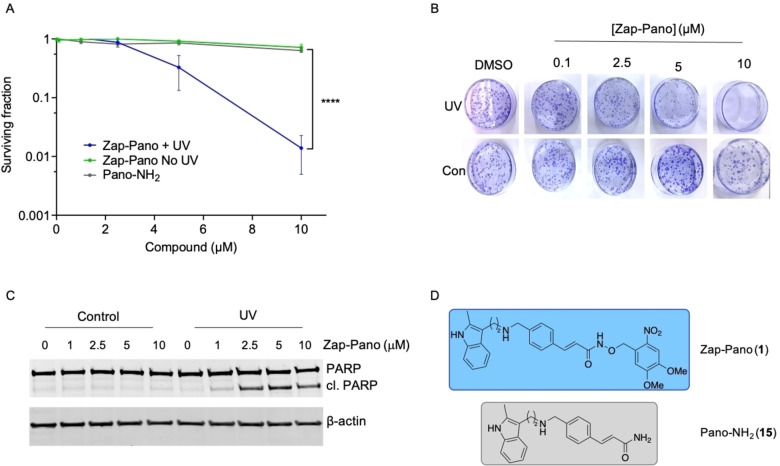
Figure 5.
Zap‐Pano leads to loss of cell viability in a UV‐dependent manner. (A) Colony survival assay of OE21 cells treated with Zap‐Pano and Pano‐NH2. [44] Cells were treated at the concentrations of Zap‐Pano shown (grey), Zap‐Pano followed by 5 min exposure to UV light (purple), and Pano‐NH2 (grey). Mean ± SEM of three independent experiments performed in triplicate are shown. Statistical significance was determined using two‐way ANOVA, ****p<0.0001. (B) Representative images from part A are shown. (C) OE21 cells were exposed to the doses indicated of Zap‐Pano for 3 h followed by UV or mock treatment (Control). Cells were harvested 24 h after UV and western blotting carried out. β‐actin is shown as a loading control. (D) The chemical structures of Zap‐Pano (1) and Pano‐NH2 (15).

