
FIGURE 1.
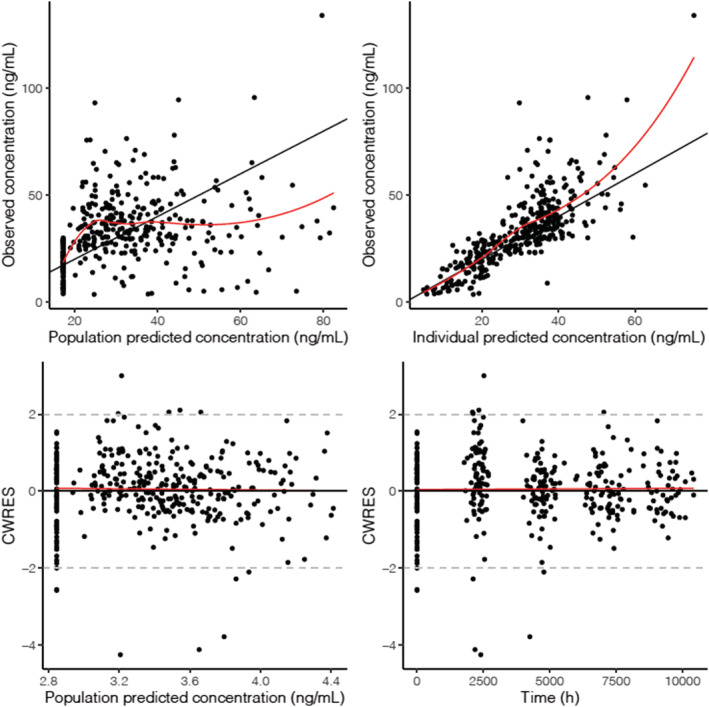
Goodness‐of‐fit plots for the final model. Top row: observations vs. population predictions, observations vs. individual predictions. Bottom row: conditional weighted residuals (CWRES) vs. population prediction, CWRES vs. time. Data have been back‐transformed for interpretation