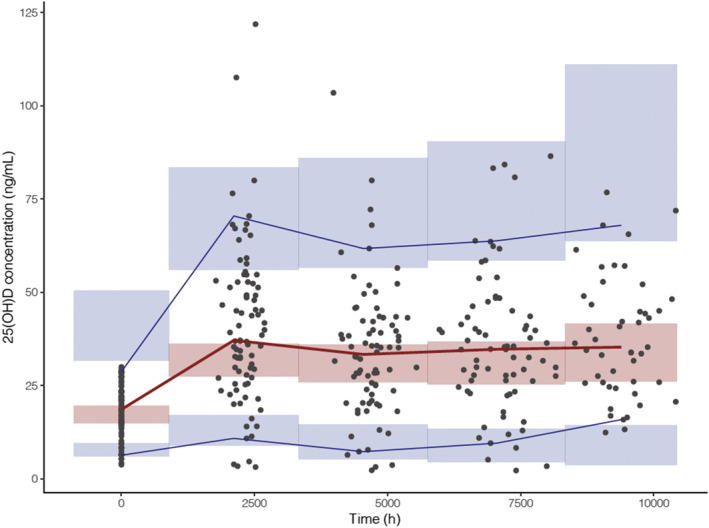
FIGURE 2.

Predicted corrected visual predictive check of the final model. Lines represent the observed 25‐hydroxyvitamin D (25(OH)D) concentrations (5th, 50th and 95th percentiles) and the shaded areas represent the 95% confidence interval around the simulated 25(OH)D concentrations percentiles (5th, 50th and 95th percentiles). Black circles represent the observed data. n = 36 (9.9%) observed concentrations were outside the predicted range
