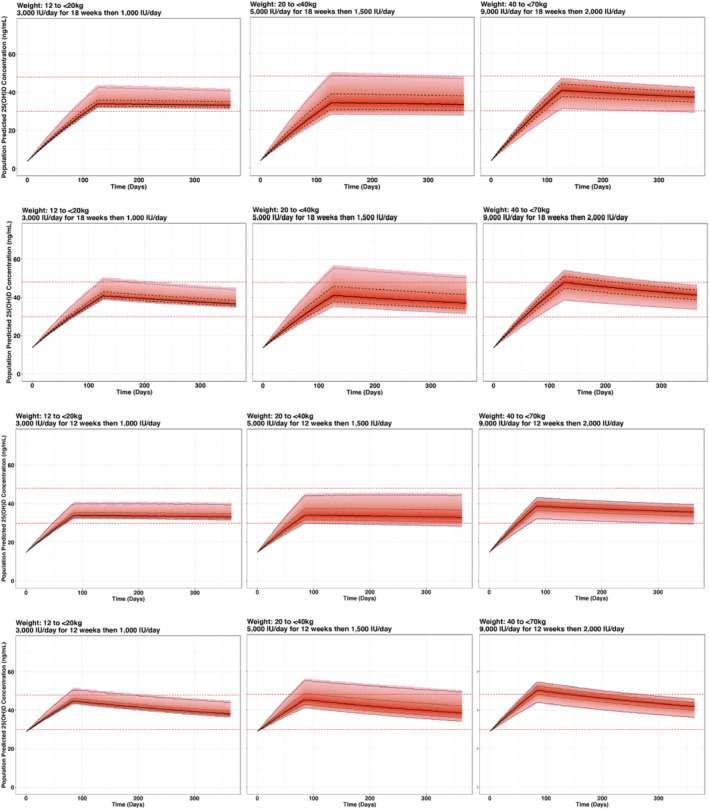
FIGURE 4.

Simulated 25‐hydroxyvitamin D (25(OH)D) concentration–time profiles based on proposed weight‐based dosing regimens accounting for different baseline 25(OH)D concentrations (from top to bottom row: 4, 14, 15 and 29 ng/mL, respectively). The red horizontal dashed lines represent the target 25(OH)D concentration range of 30 and 48 ng/mL. Black lines represent the median (solid), 50% percentile interval (dashed) and 95% percentile interval (dotted)
