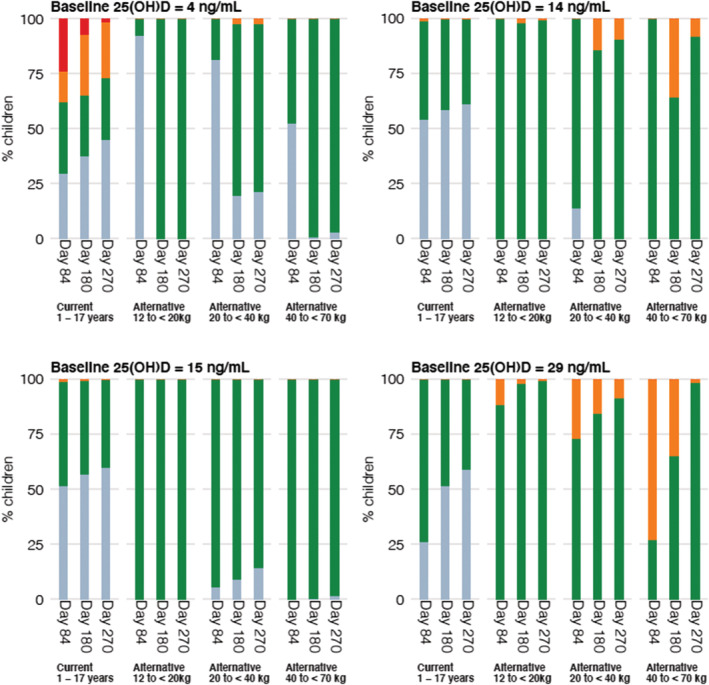
FIGURE 5.

Simulated 25‐hydroxyvitamin D (25(OH)D) concentrations at different time points administered as current dosing recommendations and proposed weight‐based dosing regimens. The coloured bar represents the proportion of children with 25(OH)D concentrations < 30 ng/mL (blue), 30–47 ng/mL (green), 48–60 ng/mL (orange) and >60 ng/mL (red)
