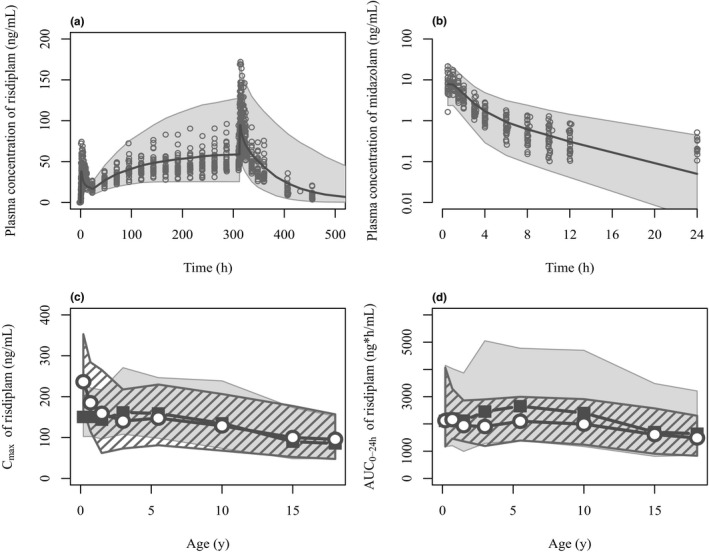
Figure 2.

Comparisons of simulated risdiplam and midazolam pharmacokinetics by the PBPK model with the observed data in adults and pediatric population. (a) Risdiplam plasma concentration‐time profiles after oral 8 mg once daily administration for 14 days in 27 healthy subjects. The plot in semi‐log scale as well as the profiles after 5 mg are shown in Supplementary Material ‐5 . (b) Midazolam plasma concentration‐time profiles after 2 mg oral administration in the presence of risdiplam predicted with the refined k inact (1/18 of the in vitro k inact). Sixty percent of the samples at 24 hours after midazolam administration were below the quantification limit (0.1 ng/mL). Observations (circles) and simulations as median (solid line) and 90% prediction interval (shaded area) are shown. Simulated risdiplam (c) Cmax and (d) AUC0–24h values in pediatric patients (gray shade) compared with the observed Cmax and individually estimated AUC0–24h using post hoc PK parameters of population PK model (striped shade). 35 Geometric means of simulated (solid squares) and observed (open circles) values are shown. The observations originate from 372 pediatric patients with SMA aged 2 months–18 years. Geometric means of the simulated risdiplam Cmax and AUC0–24h are within 0.8–1.25 fold of the observations except for Cmax of 2–7 months (0.636) and AUC0–24h of 2–4 years (1.29) and 4–7 years (1.26). AUC0–24h, area under the concentration‐time curve over 24 hours; Cmax, maximum concentration; k inact, inactivation constant; PBPK, physiologically‐based pharmacokinetic.
