
FIGURE 2.
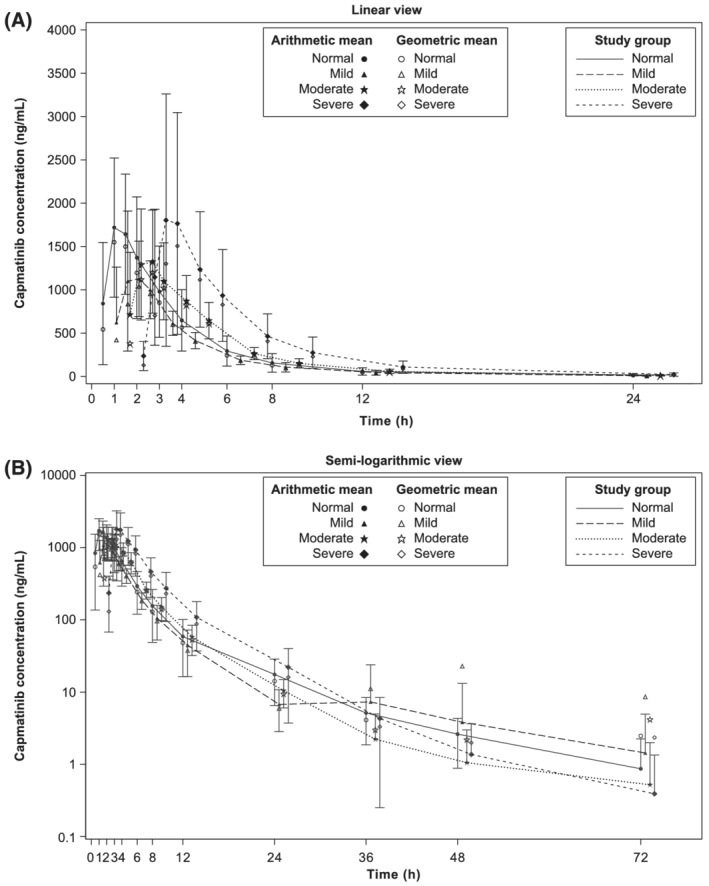
Geometric mean and arithmetic mean (standard deviation) concentration–time profiles for capmatinib by study group in (A) linear view and (B) semi‐logarithmic view (pharmacokinetic analysis set). Zero concentrations at individual time points are excluded from geometric mean computation