
Figure 2.
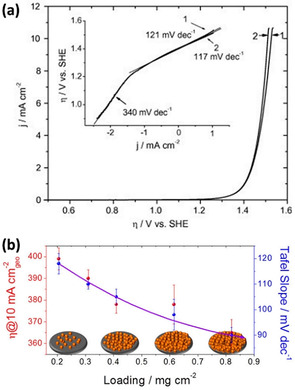
a) LSV curves (1) before and (2) after Ohmic drop correction on the boron‐doped diamond electrode; inset shows the corresponding Tafel plots. Reprinted with permission from ref. [45] Copyright 2018, Elsevier. b) Plots of NiO loading on the electrode against the value of η 10 and the Tafel slope, which were derived from the LSV result after Ohmic drop correction. Reprinted with permission from ref. [41] Copyright 2019, American Chemical Society.