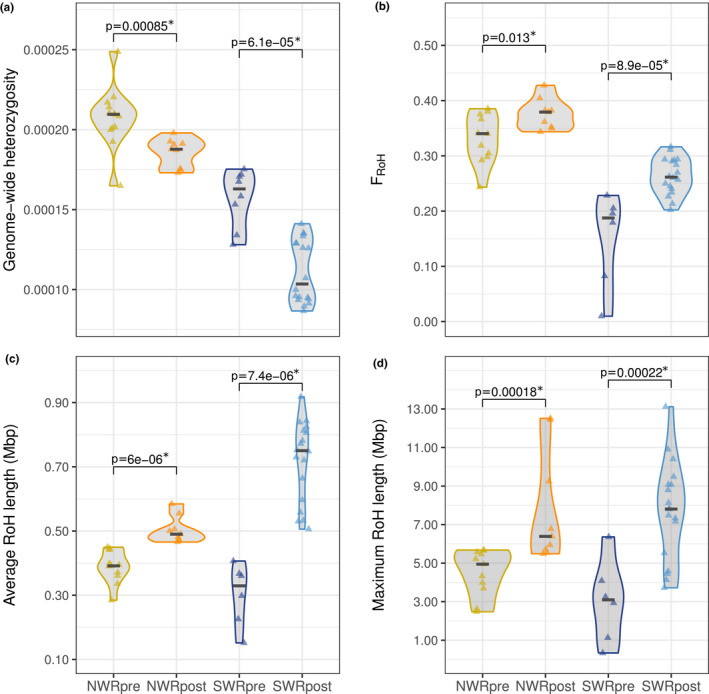
FIGURE 4.

Temporal comparisons of genomic diversity metrics in northern and southern white rhinoceroses. (a) Estimates of individual genome‐wide heterozygosity grouped by subspecies and time window. (b) Estimates of inbreeding as the fraction of the 10 largest autosomal scaffolds within RoH per individual, grouped by subspecies and time window. (c) Average length of RoH, and (d) maximum length of RoH grouped by subspecies and time window. In all four panels, the p‐values above pre‐ and post‐bottleneck groups correspond to one‐sided Wilcoxon Sum Rank tests. Significant p‐values (below a significance threshold of .05) are marked with an asterisk
