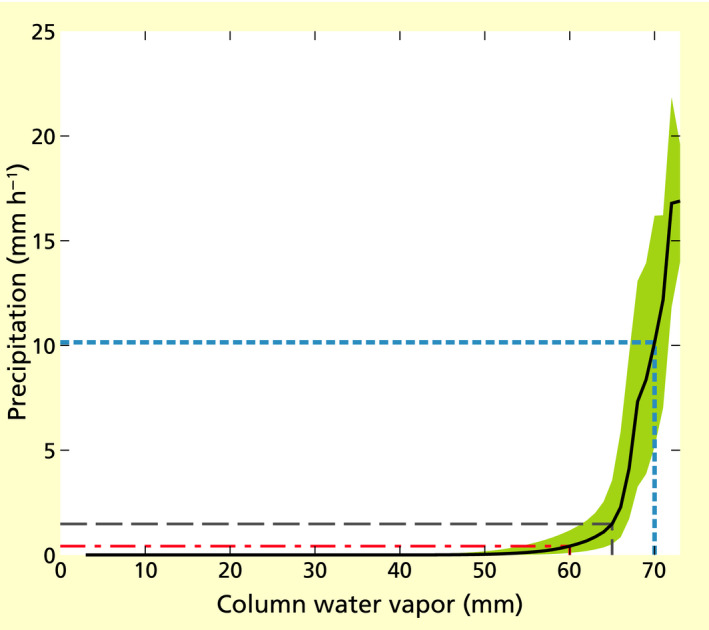
FIGURE 2.

The relation between hourly precipitation (p, in mm h−1) and column water vapor (cwv, in mm) in the study area and period, according to ERA5 data. The black line gives the median (p 50) and the shaded area the interquartile range (between p 25 and p 75). The relation is strongly nonlinear. To illustrate this, the black, long‐dashed line indicates that the precipitation at a cwv of 65 mm is equal to 1.5 mm h−1. At 5 mm lower cwv (red, dash‐dotted line), precipitation is 0.4 mm h−1, thus 1.1 mm h−1 lower than at cwv = 65 mm; at 5 mm h−1 higher cwv (blue, short‐dotted line), precipitation is 10.2 mm h−1, thus 8.7 mm h−1 higher than at cwv = 65 mm
