
Figure 2.
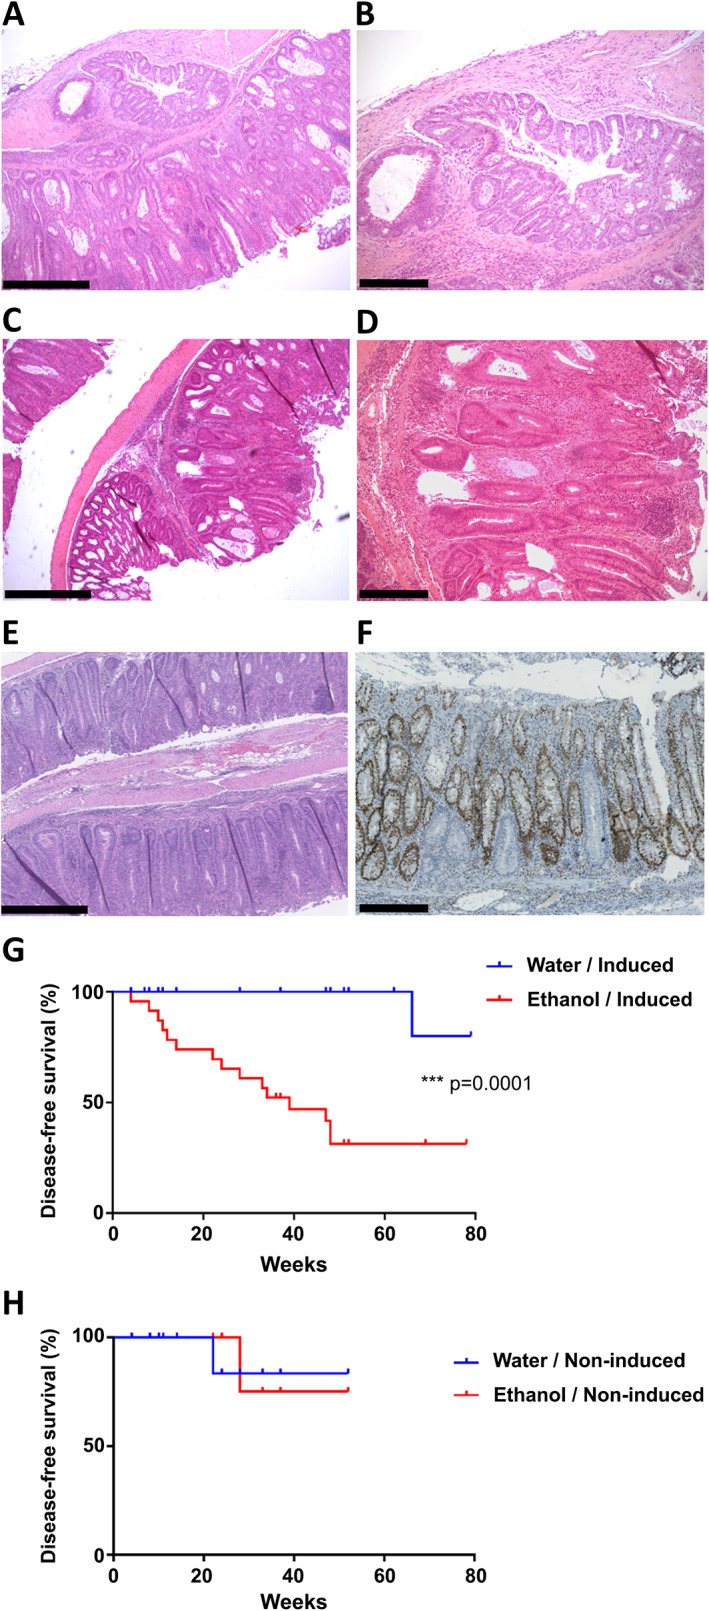
Large intestinal tumours and survival analysis. (A–D) Representative images of proximal colonic invasive adenocarcinoma (A, B) and proximal colonic adenoma (C, D) in ethanol‐treated induced Msh2‐LS mice, respectively. (E) Representative image of colonic crypt epithelial hyperproliferative changes in ethanol‐treated induced Msh2‐LS mice, demonstrating the increase in length of the affected crypts. (F) Representative image of MSH2 immunostaining of murine colonic hyperproliferative zone with some MSH2‐negative crypts from ethanol‐treated induced Msh2‐LS mice. Original magnification: 50× (A, C, E); 100× (B, D, F). Scale bars: 500 μm (A, C, E); 250 μm (B, D, F). (G) Tumour incidence shown as survival curves in induced Msh2‐LS mice treated with either 20% ethanol (red) or water (blue); log‐rank (Mantel–Cox) test, ***p = 0.0001. (H) Tumour incidence shown as survival curves in non‐induced Msh2‐LS control mice (with no Cre activation and thus no MSH2‐negative cells or crypts) treated with either 20% ethanol (red) or water (blue); log‐rank (Mantel–Cox) test, no significant differences observed.