
Figure 3.
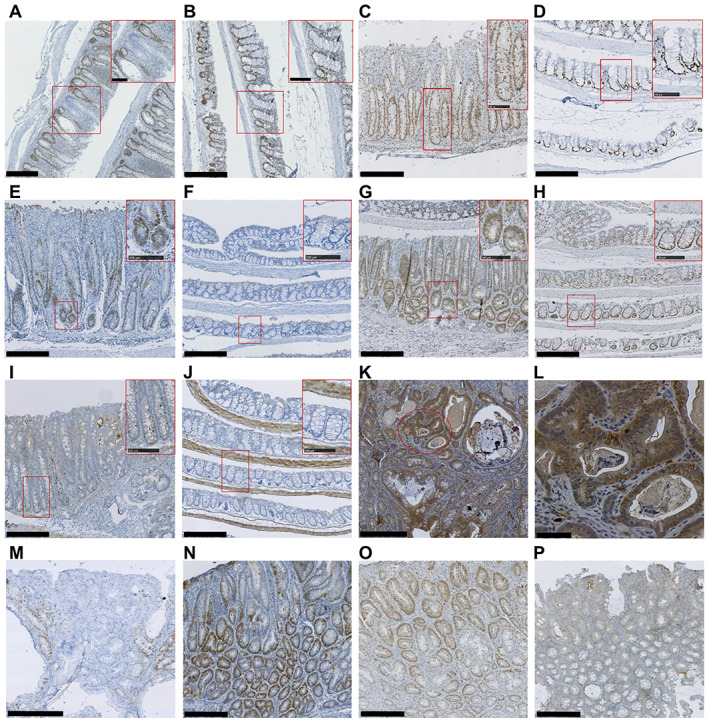
Representative images of IHC analysis of induced Msh2‐LS murine colonic mucosal epithelium and adenomas. (A, B) MSH2 immunostaining of murine colon from ethanol‐treated induced Msh2‐LS mice (A) and water‐treated induced Msh2‐LS mice (B). (C, D) Ki‐67 immunostaining of murine colon from ethanol‐treated induced Msh2‐LS mice (C) and water‐treated induced Msh2‐LS mice (D). (E, F) Immunostaining for γ‐H2AX in ethanol‐treated induced Msh2‐LS mice (E) and water‐treated induced Msh2‐LS mice (F). (G, H) Immunostaining for p53 in ethanol‐treated induced Msh2‐LS mice (G) and water‐treated induced Msh2‐LS mice (H). (I, J) Immunostaining for cCas3 in ethanol‐treated induced Msh2‐LS mice (I) and water‐treated induced Msh2‐LS mice (J). All main panels show original magnification of 100× (with further magnification of 200× in the upper right inset red rectangles). (K, L) Representative image of β‐catenin immunostaining in colonic adenoma from ethanol‐treated induced Msh2‐LS mouse (K), with selected area (red oval) within image K (original magnification 100×) further magnified to 400× in image L. (M–P) Representative images of colonic adenomas from ethanol‐treated induced Msh2‐LS mice immunostained for MSH2 (M), γ‐H2AX (N), p53 (O), and cCas3 (P). Original magnification: 100× (M–P). Scale bars: 250 μm (A–K, M–P, main panel); 100 μm (A–J, inset rectangles); 50 μm (L, main panel).