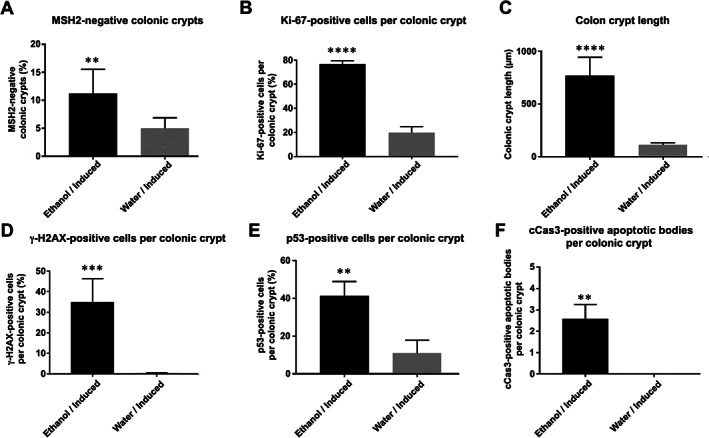
Figure 4.

Quantitative analyses of immunohistochemical stains of murine colonic mucosa from ethanol‐ (black bar) and water‐treated (grey bar) induced Msh2‐LS mice. (A) Percentage of MSH2‐negative colonic crypts; paired Student's t‐test, **p = 0.0029 versus water. (B) Percentage of Ki‐67‐positive cells per colonic crypt; paired Student's t‐test, ****p < 0.0001 versus water. (C) Colonic crypt lengths (μm); Mann–Whitney U‐test, ****p < 0.0001. (D) Percentage of γ‐H2AX‐positive cells per colonic crypt; paired Student's t‐test, ***p < 0.0009 versus water. (E) Percentage of p53‐positive cells per colonic crypt; paired Student's t‐test, **p < 0.0011 versus water. (F) Number of cleaved caspase‐3 (cCas3)‐positive apoptotic bodies per colonic crypt; paired Student's t‐test, **p = 0.0026 versus water (data shown as mean ± SD error bars, n = 6 for all comparisons).
