
Figure 5.
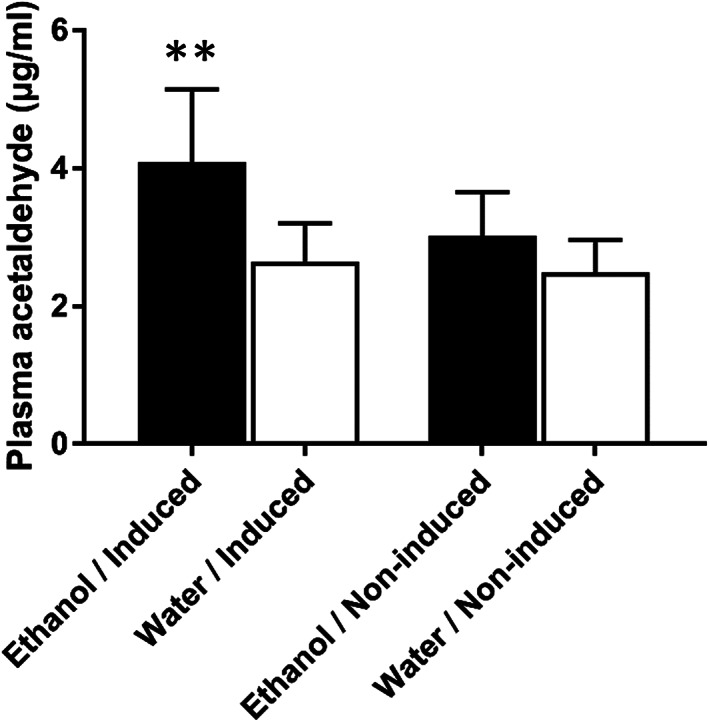
Plasma acetaldehyde concentrations in ethanol‐ (black bar) and water‐treated (white bar) induced Msh2‐LS mice and non‐induced Msh2‐LS mice; Mann–Whitney U‐test, **p = 0.0019 (data shown as mean ± SD error bars, n = 4–6).
Official websites use .gov
A
.gov website belongs to an official
government organization in the United States.
Secure .gov websites use HTTPS
A lock (
) or https:// means you've safely
connected to the .gov website. Share sensitive
information only on official, secure websites.
Plasma acetaldehyde concentrations in ethanol‐ (black bar) and water‐treated (white bar) induced Msh2‐LS mice and non‐induced Msh2‐LS mice; Mann–Whitney U‐test, **p = 0.0019 (data shown as mean ± SD error bars, n = 4–6).