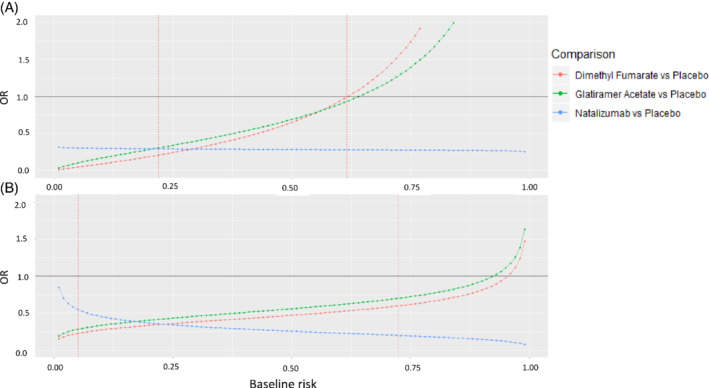
FIGURE A3.

ORs of relapse in 2 years as a function of the baseline risk estimated with LASSO, A or prespecified model, B. The x‐axis shows the baseline risk score of relapsing in 2 years. Between the two dashed vertical lines are the baseline risk values observed in our data. LASSO, least absolute shrinkage and selection operator; ORs, odds ratios [Colour figure can be viewed at wileyonlinelibrary.com]
