
FIGURE 2.
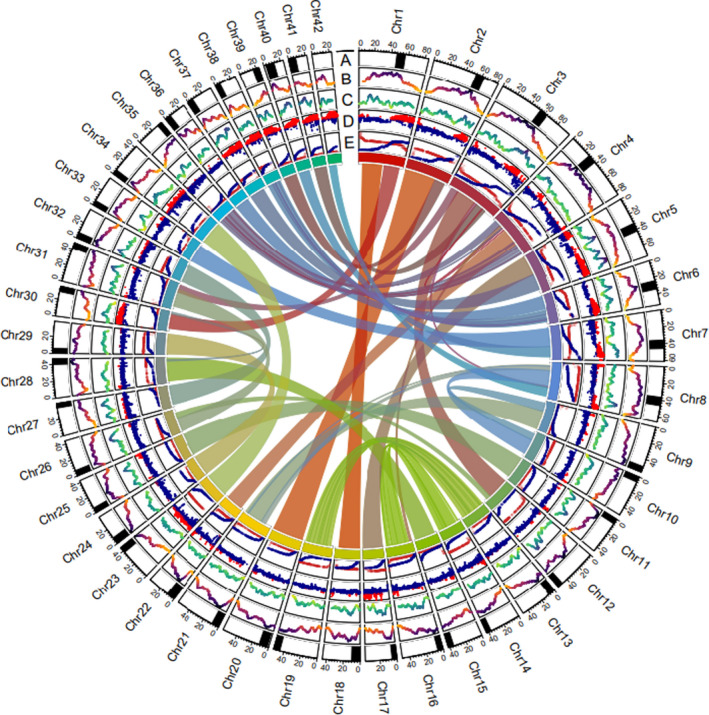
Circos plot displaying centromere positions, Tcl‐Mariner abundance, density of annotated protein coding genes, local homeolog sequence identity, male and female Lake Trout (Salvelinus namaycush) linkage maps, and homeolog pairs resulting from Ss4R. (A) Black boxes in the outside ring display the mean mapping positions (±5 Mb) for centromere associated RAD loci from Smith et al. (2020). (B) The second ring displays Z‐transformed Tcl‐Mariner repeat abundance in 5 Mb sliding windows with an offset of 100 kilobases. (C) The third ring displays the density of annotated genes in 5 Mb sliding windows with an offset of 100 kilobases. (D) The fourth ring displays local homeolog identity between syntenic blocks detected by SynMap2. Red points correspond to windows with elevated sequence identity putatively resulting from delayed rediploidization (posterior probability >0.5). Blue points correspond to windows with elevated sequence divergence between homeologs. (E) The fifth ring displays map distance (centimorgans) for male (red) and female (blue) linkage maps (y‐axis) versus physical distance (x‐axis) for each of the 42 chromosomes. Connections are drawn between syntenic blocks identified by symap v5 putatively resulting from Ss4R