
FIG 1.
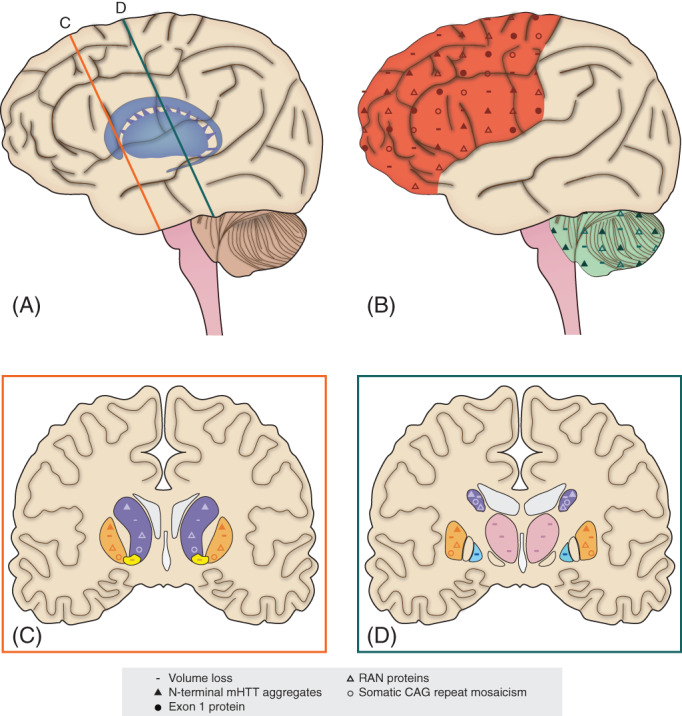
Schematic illustration showing differences in juvenile‐onset Huntington disease (JHD) neuropathology in comparison with adult‐onset Huntington disease (AHD) neuropathology. More severe pathological hallmarks of JHD brains are seen in A, inset C and D: the subcortical grey matter structures and B: the frontoparietal cortex and, to a lesser extent, the cerebellum. Volume loss (−) is more pronounced in the frontoparietal cortex (red), cerebellum (green), caudate nucleus (purple), putamen (orange), nucleus accumbens (yellow), internal segment of the globus pallidus (blue), and the thalamus (pink). N‐terminal mutant huntingtin (mHTT) aggregates (▴) are more abundant in the frontal cortex, caudate nucleus, putamen, and, to a lesser extent, cerebellum of JHD brains. Exon 1 protein (●) is more abundant in the frontoparietal cortex and hippocampus (not displayed) of JHD brains. Repeat‐associated non‐ATG nuclear (RAN) proteins () are more abundant in the striatum, frontal cortex, and cerebellum of JHD brains. Somatic CAG repeat mosaicism () is greater in the neocortex, caudate nucleus, and putamen of JHD brains. [Color figure can be viewed at wileyonlinelibrary.com]