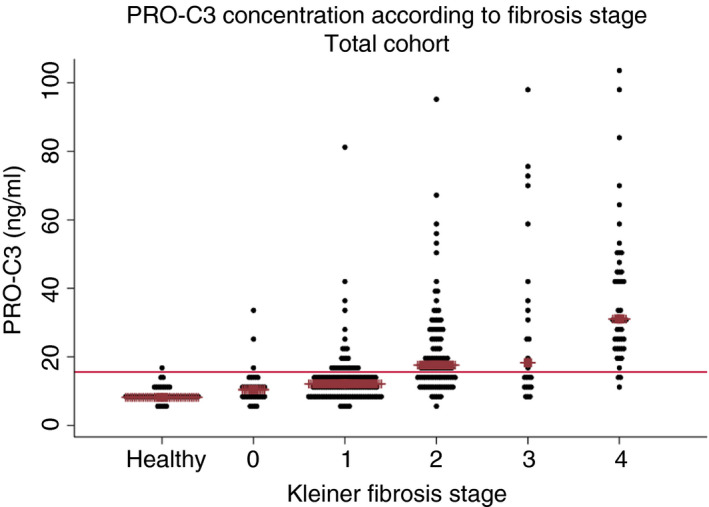
FIGURE 2.

PRO‐C3 concentration in serum according to Kleiner fibrosis stage. Dotplot of the serum concentration of PRO‐C3 in the healthy population group and its relation to the Kleiner fibrosis stage in the total cohort of patients with current or prior alcohol overuse. The brown line indicates the median value
