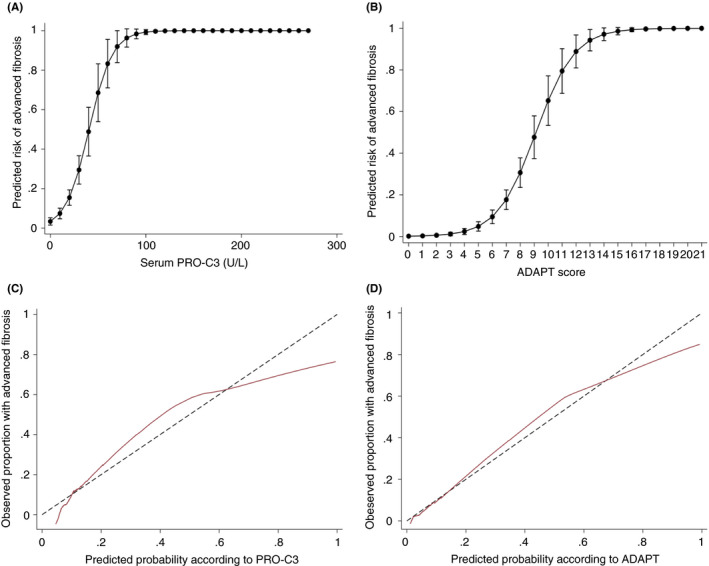
FIGURE 4.

Risk prediction and calibration curves according to serum PRO‐C3. (A and B) Risk‐prediction curves to evaluate the probability of advanced fibrosis according to the serum concentration of PRO‐C3 and the ADAPT score. (C and D) Calibration slopes for PRO‐C3 and the ADAPT score in the total cohort. The marron line graphs the agreement between predicted probability of advanced fibrosis on the x‐axis and observed proportion with advanced fibrosis on the y‐axis. The perfect calibration with 100% agreement is marked with a black dashed line
