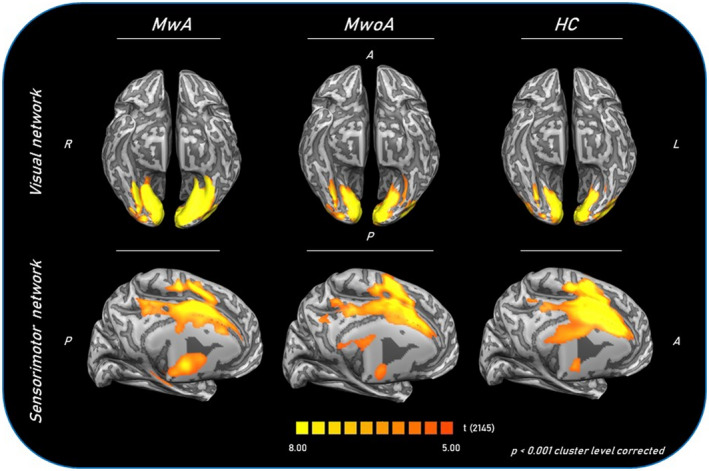
FIGURE 1.

Group‐level (main effects) functional connectivity of visual and sensorimotor networks in MwA patients (as a group), MwoA patients and HCs. Statistical maps were obtained overlaying an inflated 3D brain surface from the ‘Colin 27’ atlas. A, anterior; HC, healthy control; MwA, migraine with aura; MwoA, migraine without aura; P, posterior; R, right; L, left
