FIGURE 5.

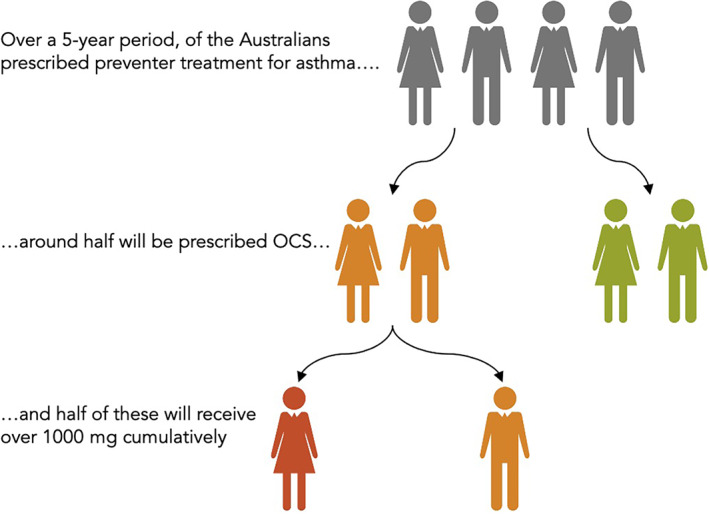
Natural frequency diagram highlighting the prevalence of high cumulative dose oral corticosteroid exposure in asthma. Based on data from studies by Hew et al. 23

Natural frequency diagram highlighting the prevalence of high cumulative dose oral corticosteroid exposure in asthma. Based on data from studies by Hew et al. 23