FIGURE 2.

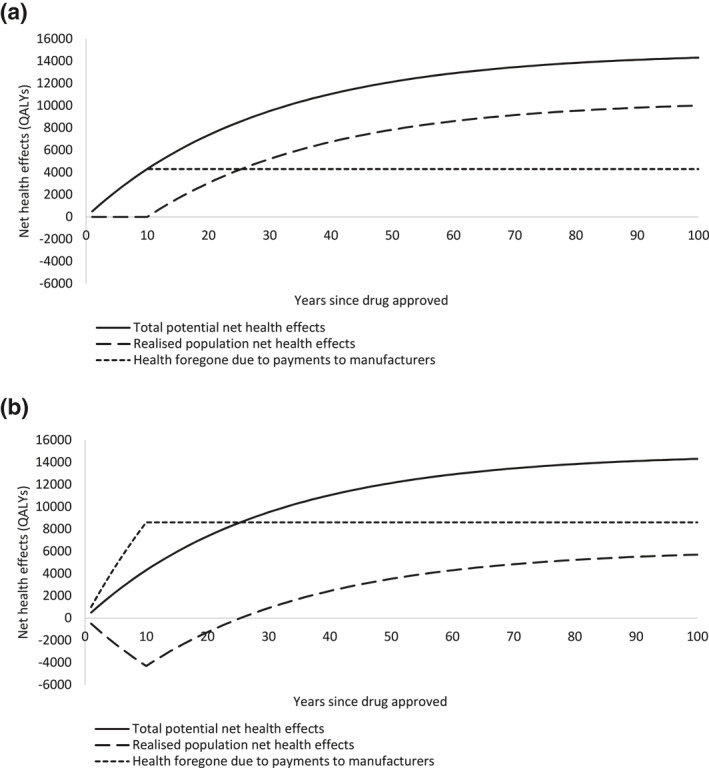
Net health effects accruing to different parties over time for (a) 15,000/quality‐adjusted life year (QALY) approval norm, and (b) 30,000/QALY approval norm for numeric example

Net health effects accruing to different parties over time for (a) 15,000/quality‐adjusted life year (QALY) approval norm, and (b) 30,000/QALY approval norm for numeric example